Security Audit and SIEM Integration
Scope
Portainer records every user action and system event at the control plane level. This chapter covers how that audit trail is routed to enterprise security platforms for threat detection, compliance reporting, and SOC operations. This is distinct from operational observability (Ch. 9): the data source is Portainer's own audit log stream, not workload stdout or metrics. The primary consumers are the security team and auditors.
Four SIEM integration patterns are covered: Microsoft Sentinel (Azure / Microsoft stack), Splunk (Enterprise Security), Elastic Security / OpenSearch (open-source) and Wazuh (recommended for fully open-source environments, the SIEM and XDR platform in the CNCF reference observability stack).
All four patterns support Portainer audit event ingestion and the Kubernetes API server audit log. Wazuh additionally provides out-of-the-box compliance dashboards for CIS Benchmarks, PCI-DSS, SOC 2, and HIPAA without additional rule authorship.
10.1 SIEM Architecture Principles
Portainer’s audit trail is a first-class security signal, not a secondary concern. The Portainer control plane records every user action and system event that passes through it — authentication events, RBAC changes, deployment operations, configuration changes, policy violations, and environment access — and this record is the authoritative evidence source for container management control plane activity in compliance audits, incident investigations, and SOC operations.
Control-plane audit events are distinct from workload logs (Chapter 9) and require separate treatment. Workload logs describe what applications are doing; the Portainer audit log describes who is doing what to the platform that manages those applications — who deployed what, who changed which access control, who connected to which cluster. These events have different consumers (security team and auditors vs. platform engineers), different retention requirements, and different threat detection use cases. They must not be co-mingled in the same SIEM pipeline or retention tier.
The SIEM integration pipeline follows the pattern: event generation (Portainer emits structured JSON events to its internal log store and optionally to syslog) → export (Portainer direct syslog forwarding) → ingestion (SIEM-specific ingestion path) → correlation (cross-source joins with Kubernetes API server audit log, and optionally Falco runtime events for environments requiring advanced runtime security) → detection (rule-based alerts for the use cases in section 10.4) → response (SOC investigation case via Chapter 9).
Portainer generates and ships the signal; the SIEM provides the analysis. The architectural division of responsibility is explicit: the Kubernetes Management Platform’s role is to emit full user action, policy, and GitOps audit events to the SIEM. Security analysis, correlation, and incident response are the specialist tool’s responsibility. Portainer does not attempt to perform security analytics or threat detection — it ensures the event stream is complete, correctly attributed, and reliably delivered. This separation maps directly to the Service Plane architecture in which Portainer handles audit streaming as a cross-cluster service while downstream specialist systems consume and act on it.
Portainer emits two distinct audit log streams for SIEM ingestion:
- Authentication Activity Log: Login events, logout events, failed authentication attempts, session creation and expiry, SSO token validation outcomes, and brute-force lockout events. This stream is the primary source for identity threat detection use cases.
- User Activity Log: All user-initiated and system-initiated actions within Portainer — deployment operations, RBAC changes, registry configuration, GitOps stack changes, policy operations, environment management, and administrative events. This stream is the primary source for deployment anomaly detection, configuration tampering detection, and compliance audit evidence.
10.2 Portainer Audit Log Scope
The Cluster Access Broker is the architectural foundation of audit completeness. All operational actions in a Portainer-managed platform flow through the Portainer Access Broker before reaching any individual cluster — the broker validates identity, checks authorisation, verifies policy compatibility, and logs each action before forwarding it. Users do not interact directly with the Kubernetes API; they operate through the Portainer control plane. This is why Portainer’s audit trail is structurally comprehensive rather than partial: there is no legitimate path to perform a governed operation that bypasses the control plane, and therefore no legitimate path that bypasses the audit record. The audit log is a consequence of the single-control-plane model, not an optional logging feature.
Three independent audit log streams
Portainer audit log storage: Portainer stores its own audit and activity logs in a separate bboltDB instance from the main configuration database. Because these logs reside in an embedded database on the management cluster, they are not inherently tamper-evident. SIEM forwarding is non-optional for regulated environments — the authoritative audit record must be the SIEM copy, not the Portainer-local copy.
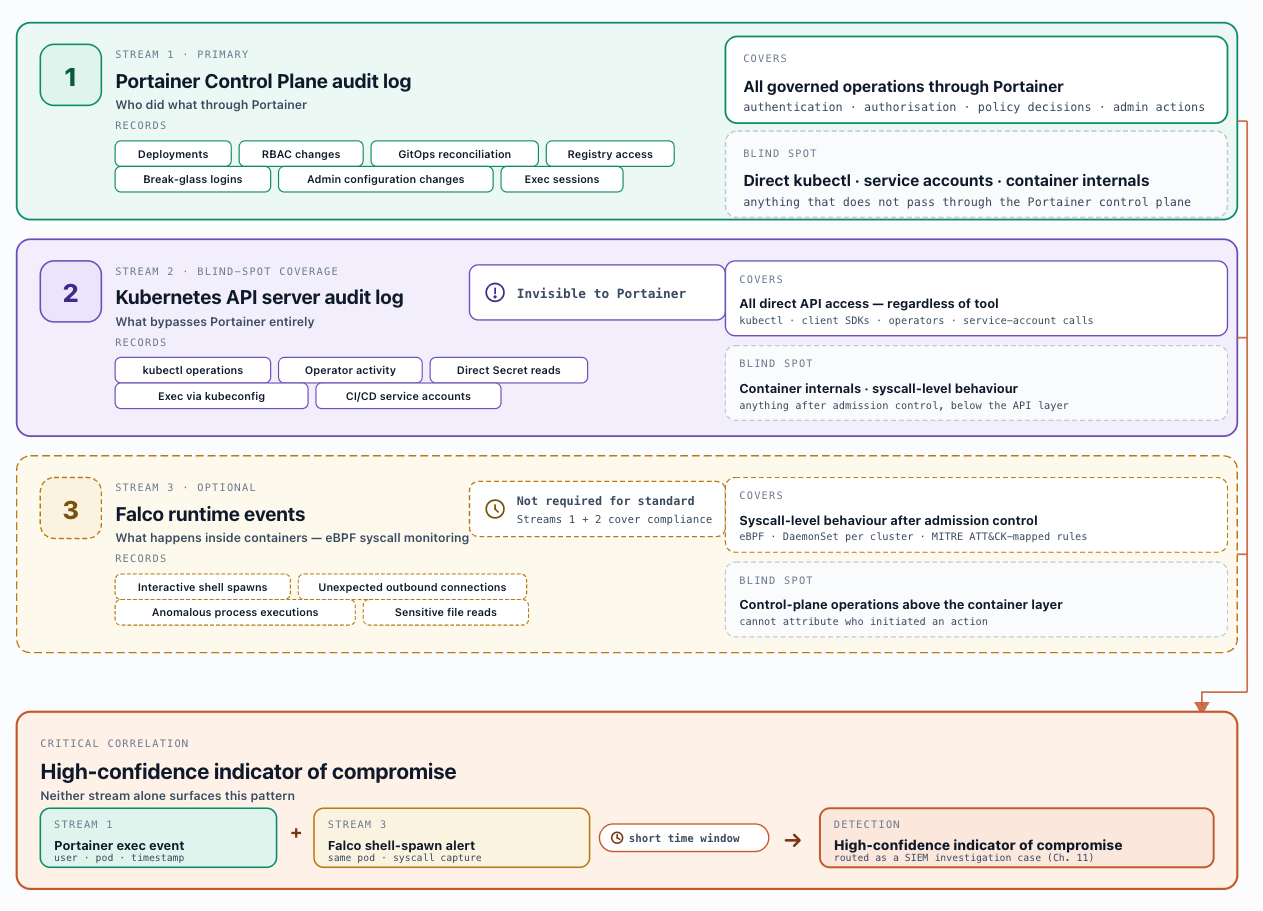
A complete SIEM pipeline for a Portainer-managed platform collects from two primary audit streams, each covering a different threat surface. The Portainer Control Plane audit log — the primary subject of this section — records every action taken through the Portainer control plane: authentication events, RBAC changes, deployment operations, and administrative actions. The Kubernetes API server audit log records every request made directly against the Kubernetes API server, including kubectl operations, operator activity, and service account calls that bypass the Portainer UI entirely. A well-configured Kubernetes audit policy captures all write operations and sensitive reads (Secret access, exec calls, RBAC changes applied directly via kubectl) while suppressing high-volume noise such as health checks and watch operations — enabling and shipping this log is non-negotiable in any enterprise deployment, as it covers the access path that operates outside Portainer’s visibility. These two streams are complementary and together provide comprehensive control-plane coverage.
For organisations requiring advanced runtime security, a third optional stream can be added: the Falco runtime security event stream records workload-level syscall anomalies — interactive shells spawned in containers, sensitive file access, unexpected network connections — events that occur below the API layer and are invisible to both audit logs. Falco is appropriate for high-security environments, regulated workloads requiring behavioural detection, or organisations with active SOC operations that benefit from runtime-to-control-plane correlation. The Portainer audit log stream is described in full below; the optional Falco integration is described in the section that follows.
Each Portainer audit event includes a common metadata envelope: event timestamp, event type, actor identity (user ID, username, authentication method), source IP address, affected resource (environment, stack, user account), action performed, result (success or failure), and session or request identifier. The following categories describe the event types within each audit stream.
Authentication and session events: Login success and failure (including the authentication provider — local, OIDC, SAML, LDAP), logout, session expiry, SSO token validation outcomes, API key authentication events, and brute-force threshold events. Each failed authentication record includes the source IP and the identity attempted, enabling credential stuffing and brute-force correlation. Break-glass local account (user ID 1) login events are flagged with an elevated severity marker to support immediate SOC alerting.
Identity and access events: User account creation and deletion, role assignment changes (environment-level and global), team membership modifications (user added to or removed from a Portainer team), API key issuance and revocation, and SSO enforcement configuration changes. Each event captures the actor performing the change, the subject being modified, and the before/after state of the relevant role or membership.
Deployment events: Stack and application deployments (create, update, delete, rollback), GitOps reconciliation events (triggered sync, drift detection result, reconciliation failure), manual container operations (exec, restart, scale), and registry-sourced deployments including the registry and image reference deployed. Events include the target environment, namespace, and the Git commit SHA or image digest associated with the deployed state.
Configuration events: Registry credential addition, modification, or removal; GitOps stack source configuration changes (repository URL, branch, credentials); environment onboarding and removal; and Portainer Server administrative configuration changes (LDAP/OIDC settings, database encryption configuration, agent connection settings). These events represent changes to the platform's structural configuration and are high-priority targets for configuration tampering detection (section 10.4).
Policy events: Admission controller violation records detected via Fleet Governance Policy mechanisms, policy bundle deployment operations, and policy exemption grants. Policy violation events include the affected cluster, violated policy name, and the resource that triggered the violation.
Administrative events: Portainer backup and restore operations, license changes, management cluster configuration changes, and Portainer Server restart events. These low-frequency events establish the baseline of expected administrative activity and are valuable for detecting anomalous privileged operations.
Privileged Access Monitoring (PAM): Portainer's audit log provides a built-in privileged access record for high-risk operations. Break-glass credential access, exec (interactive shell) sessions into production workloads, cluster-admin impersonation via Portainer, Administrator role assignments, and Kubernetes Secret deletion via the Portainer interface are all captured in the User Activity Log with full context for SOC correlation. Configure SIEM detection rules to generate immediate, high-priority alerts on these event types rather than routing them through the standard alert deduplication pipeline. PAM alerts route to the SOC analyst on-call — not to the platform engineering on-call — and generate a SIEM investigation case rather than an incident (see Chapter 9 routing design).
Falco Runtime Security Events (Optional — Advanced Runtime Security)
Falco (CNCF Graduated) is an optional runtime security component for organisations requiring workload-level behavioural detection beyond what the Portainer and Kubernetes API server audit logs provide. Where deployed, it complements the API-layer audit streams described in section 10.2. Where the Portainer audit log and the Kubernetes API server audit log record control-plane operations, Falco observes workload-level behaviour using eBPF, monitoring syscalls made by processes inside cluster pods without requiring application modification or instrumentation. Falco detects threats invisible to audit logs: interactive shells spawned in production containers, sensitive file reads, unexpected outbound connections, and process executions inconsistent with the container's entrypoint. These events occur after admission control has passed and below the level any API server audit log can observe.
Deployment: When adopted, Falco runs as a DaemonSet on each managed cluster via a Helm chart deployed through Portainer’s GitOps integration (Chapter 6) or as an optional addition to the cluster profile (Chapter 3). Falco generates structured JSON alert events forwarded via Fluent Bit to the SIEM alongside the Portainer audit log stream. Portainer audit events identify who performed what action through the control plane; Falco events identify what happened inside running containers at the syscall level.
SIEM correlation: Correlate Falco events against Portainer exec events to detect attack sequences: a container exec in the Portainer audit log followed by a shell spawn and sensitive file read from Falco on the same pod within a short time window constitutes a high-confidence indicator of compromise. Neither stream alone provides the complete picture.
Rule management: Falco ships with a default ruleset mapped to MITRE ATT&CK. Calibrate rules to the specific workload profile before production to avoid SOC alert fatigue. Manage rule customisations as versioned Git manifests alongside Kyverno policies and Prometheus alerting rules.
10.3 SIEM Integration Patterns
Splunk
Splunk serves as both log aggregation and SIEM platform in many enterprises. Portainer audit events reach Splunk via two patterns: (1) Portainer syslog forwarding targets a Fluentbit instance running the Splunk HEC output plugin; (2) Fluentbit runs directly on the management cluster and forwards the Portainer log stream to the Splunk HEC endpoint. Store the HEC token in the platform’s secrets store (Chapter 8). Write Portainer events to a dedicated Splunk index ( portainer_audit ) separate from infrastructure logs, enabling index-level RBAC so that only SOC analysts and auditors can query the audit index.
CIM field mapping: Map Portainer event fields to the Splunk Common Information Model to enable correlation with other data sources and participation in Splunk ES correlation searches. Key mappings: Portainer Username → CIM user ; AuthenticationMethod → authentication_method ; ResourceID → object ; Action → action ; SourceIP → src_ip ; Result → status . With CIM mapping, Portainer events participate in Splunk ES risk-based alerting and correlation searches without bespoke parser development.
Detection in Splunk ES: Create Notables for each high-severity Portainer event type and map to the relevant MITRE ATT&CK technique for SOC triage context: privilege escalation (RBAC elevation outside change windows — T1078 Valid Accounts), authentication anomalies (success following repeated failures — T1110 Brute Force), exec session anomalies (interactive shell to production workload — T1059 Command and Scripting Interpreter). Risk-based alerting (RBA) accumulates risk scores from multiple lower-confidence Portainer events before generating a Notable, reducing SOC alert fatigue while maintaining detection coverage.
Microsoft Sentinel
Portainer audit events reach Microsoft Sentinel via a Data Collection Rule (DCR) ingestion pipeline. The recommended path is: Portainer syslog → Fluentbit → Log Analytics HTTP Data Collection API or DCE endpoint → custom table PortainerAudit_CL in the Log Analytics workspace. For environments already running the Azure Monitor Agent (AMA), the syslog data source in the DCR can capture Portainer forwarded events and apply transformation rules before ingestion.
Workspace and table design: Create a dedicated custom table ( PortainerAudit_CL ) in the Log Analytics workspace rather than writing to the general Syslog or CommonSecurityLog tables. A dedicated table enables targeted retention policies aligned to the applicable compliance framework (see section 10.5), table-level RBAC restricting query access to SOC analysts and auditors, and lower ingestion cost via the basic log tier for the archive layer.
Entra ID identity correlation: Portainer authentication events include the Username field, which for OIDC- and SAML-integrated deployments matches the user's Entra ID UPN. Correlate PortainerAudit_CL against SigninLogs (Entra ID sign-in events in Sentinel) using Username == UserPrincipalName to detect cross-source attack patterns: a Portainer administrative action performed within a short window of a risky Entra ID sign-in event; a source IP mismatch between the Entra ID sign-in and the Portainer action; or Portainer access following Entra ID identity protection risk elevation (risky user state). This correlation is the key advantage of Sentinel for organisations in the Microsoft security stack — it links the container management control plane event to the full identity risk context provided by Chapter 4's OIDC integration.
| KQL detection rules: Author Sentinel Scheduled Query Rules in KQL targeting the PortainerAudit_CL table. Representative patterns: RBAC escalation outside a change window ( ResourceControl == "role" and Action == "update" and hour(TimeGenerated) !between (8 .. 18) ); break-glass account usage ( Username == "admin" or UserID == "1" ); exec session to production namespace ( Action == "exec" and Namespace in (prod_namespaces) ); and authentication spike ( summarize count() by Username, bin(TimeGenerated, 5m) | where count_ > threshold ). Map each rule to its MITRE ATT&CK technique in the rule metadata to enable automatic technique tagging on Sentinel incidents. PAM event types (break-glass access, exec sessions, Administrator role assignments — section 10.2) should generate a Sentinel Incident rather than a raw alert, enabling SOC case management, the investigation timeline view, and routing to the SOC analyst on-call rather than the platform engineering on-call. |
|---|
Elastic Security / OpenSearch Security
Portainer audit events reach Elasticsearch via two supported paths: (1) Fluentbit running on the management cluster with the Elasticsearch output plugin forwarding to a dedicated index; (2) a Logstash pipeline receiving Portainer syslog events, applying a structured parsing filter (grok for syslog framing, then JSON parsing of the Portainer payload), and outputting to Elasticsearch via an ILM-managed index pattern. For environments running OpenSearch (AWS OpenSearch Service or self-managed), the same Fluentbit or Logstash path applies using the OpenSearch output plugin.
ECS field mapping: Map Portainer event fields to the Elastic Common Schema to enable Elastic Security detection rules and investigation timeline views. Key mappings: Username → user.name ; UserID → user.id ; SourceIP → source.ip ; Action → event.action ; Result → event.outcome ( success or failure ); ResourceType → event.category ; ResourceID → resource.id . With ECS compliance, Portainer events participate in Elastic Security's prebuilt detection rules that match on event.action , user.name , and source.ip across all ingested sources, enabling cross-source correlation without bespoke rule development for common patterns.
Index design and ILM: Write Portainer events to a dedicated index pattern ( portainer-audit-* ) managed by an ILM policy with three phases: hot (full search performance, 30 days); warm (read-only, compressed, 90 days); cold (frozen tier or searchable snapshot for compliance retention — see section 10.5). Apply field-level security in Elasticsearch to restrict access to portainer-audit-* indices to the SOC analyst role. For OpenSearch, use Fine-Grained Access Control (FGAC) with an equivalent index-level permission pattern.
Detection rules: Author Elastic Security custom query rules targeting the portainer-audit-* index and map each rule to a MITRE ATT&CK technique in the rule metadata. For OpenSearch Security Analytics, detection rules can be authored in Sigma-compatible format — ECS field mapping enables direct translation of Elastic Security rules to the OpenSearch format with minimal field name adjustment, reducing the authoring overhead for teams maintaining both platforms.
Generic SIEM via Syslog / Webhook
Portainer Business Edition supports streaming authentication and activity logs directly to any syslog-compatible SIEM receiver via CLI flags at container startup. This is the integration path for SIEM platforms without a native Kubernetes or Portainer connector.
The full set of CLI flags:
| Flag | Description | Default |
|---|---|---|
| --syslog-address | FQDN or IP address of the syslog receiver | (required) |
| --syslog-port | Syslog port | 514 |
| --syslog-protocol | Transport: udp , tcp , or tcp+tls | udp |
| --syslog-format | Log format: rfc3164 or rfc5424 | rfc5424 |
| --syslog-source-hostname | Hostname shown in syslog messages | portainer |
| --syslog-ca-cert | Path to trusted CA for TLS verification | /syslog/certs/ca.pem |
| --syslog-cert | Path to client certificate for mTLS | /syslog/certs/cert.pem |
| --syslog-key | Path to client private key for mTLS | /syslog/certs/key.pem |
| --syslog-insecure-skip-verify | Disable TLS server verification (testing only) | false |
Transport: The default protocol is udp , which provides no delivery confirmation and must not be used in production or regulated environments. Use --syslog-protocol tcp for production and --syslog-protocol tcp+tls for any configuration where audit events cross a network boundary or where mutual authentication is required.
Format: The default rfc5424 (structured syslog) is recommended for all modern SIEM platforms — it provides structured fields that enable field-level correlation without custom parsing rules. Use rfc3164 only for legacy SIEM platforms that do not support RFC 5424.
mTLS: For regulated environments requiring mutual authentication on the forwarding channel, supply --syslog-cert , --syslog-key , and --syslog-ca-cert pointing to the appropriate certificate material. Never set --syslog-insecure-skip-verify true outside of testing — it disables TLS server verification entirely.
Wazuh (Open Source SIEM)
For organisations with fully open-source requirements or commercial SIEM licensing constraints, Wazuh (Apache 2.0) provides SIEM and XDR capabilities without commercial licence dependency. Wazuh ingests Portainer audit events and the Kubernetes API server audit log via the Fluent Bit syslog forwarding path, and optionally Falco runtime events where Falco is deployed for advanced runtime security. It includes out-of-the-box compliance dashboards for CIS Benchmarks, PCI-DSS, and SOC 2. Wazuh also provides agent-based host monitoring for cluster nodes, complementing the container-level visibility provided by Falco. It is the recommended SIEM choice for environments where Splunk, Sentinel, and Elastic Security are excluded by licensing, cloud dependency, or cost constraints.
10.4 Detection Use Cases
The six primary SIEM detection use cases for Portainer audit events:
- Privilege escalation detection: Alert on RBAC role elevation — particularly to Administrator or Environment Administrator — outside a documented change window or without a corresponding ITSM change record. Cross-correlate with break-glass access events (Chapter 2, section 2.10) and the break-glass local account (user ID 1) login events (Chapter 4).
- Deployment anomaly detection: Alert on deployments outside approved change windows, deployments sourced from registries not on the approved list, or deployments to production namespaces by accounts whose role does not include production deployment rights.
- Authentication threat detection: Alert on repeated failed authentication attempts, successful logins following repeated failures (credential stuffing pattern), logins at anomalous times or source IPs, and any use of the break-glass local account.
- Policy bypass detection: Alert on admission controller violations in the policy event stream — particularly repeated violations from the same workload or namespace, which may indicate systematic probing for policy gaps. Alert on policy exemption grants, which should be rare, time-bounded, and correlated with an ITSM approval record.
- Configuration tampering detection: Alert on unexpected changes to GitOps stack configuration, registry definitions, or environment settings — especially by accounts that do not normally perform these operations. Changes to Portainer administrative configuration should be correlated against the change management record.
- Exfiltration indicator detection: Alert on exec (interactive console) access patterns anomalous in frequency or scope — particularly shell sessions to production workloads by users with no documented operational need, or console access immediately following a failed authentication event on the same account.
10.5 Compliance Reporting
Portainer's audit log stream serves as the primary evidence source for container management control plane activity across all major compliance frameworks. The audit events described in section 10.2 — combined with the immutable log storage and SIEM ingestion patterns in sections 10.3 and 10.6 — provide the artefacts required for access control, change management, and operational audit use cases.
SOC 2 Type II: The relevant Trust Service Criteria are CC6 (Logical and Physical Access Controls), CC7 (System Operations), and CC8 (Change Management). Portainer audit events satisfy CC6 evidence requirements by providing a complete record of role assignment changes, authentication events, and access to production environments. CC7 evidence is satisfied by the deployment event stream and policy violation records. CC8 evidence is provided by the GitOps reconciliation event stream, which establishes that production changes were applied from version-controlled manifests rather than ad-hoc manual operations.
ISO 27001: The primary controls are Annex A.12.4 (Logging and Monitoring), A.9 (Access Control), and A.12.1 (Operational Procedures and Responsibilities). Portainer's Authentication Activity Log and User Activity Log together provide the “logging of user activities, exceptions, faults and information security events” required by A.12.4.1. Role assignment events satisfy A.9 access control audit requirements. Retain logs for a minimum of 12 months to satisfy the typical ISO 27001 certification scope; confirm the exact retention period with your certification body.
PCI-DSS: Requirement 10 mandates audit log retention for a minimum of 12 months, with the most recent 3 months immediately available for analysis. For containerised cardholder data environments managed via Portainer, the audit log stream provides the required record of administrative access, authentication events, and changes to system components. Configure the SIEM hot/warm tier to retain 3 months of Portainer events at full query performance, and the cold/archive tier to satisfy the 12-month minimum. PCI-DSS Requirement 10.3 requires protection against modification or deletion of audit logs — satisfy this with S3 Object Lock WORM configuration or Azure Blob immutability policies (section 10.6).
HIPAA: The Security Rule (45 CFR § 164.312(b)) requires audit controls that record and examine activity in information systems that contain or use ePHI. For covered entities and business associates using Portainer to manage containerised workloads processing ePHI, the Portainer audit log satisfies the audit control requirement. HIPAA does not specify a retention period in the Security Rule itself, but the documentation retention requirement under 45 CFR § 164.316(b)(2)(i) requires records to be retained for 6 years from creation or last effective date. Apply a 6-year retention period to the audit log archive tier for HIPAA-scoped environments.
Tamper-evidence and log integrity: Compliance frameworks require that audit logs cannot be modified or deleted by the subjects of those logs — including platform administrators with access to the Portainer management cluster. Satisfy this requirement by routing the audit log stream to a write-once storage layer before or concurrent with SIEM ingestion: S3 Object Lock in COMPLIANCE mode (not GOVERNANCE mode, which permits bucket owner override) for AWS environments; Azure Blob immutability policy with policy lock enabled for Azure environments; or a write-once SIEM index with append-only permissions for on-premises deployments. The audit log recipient must sit outside the administrative boundary of the Portainer management cluster — a Portainer Administrator with kubectl access to the management cluster must not be able to modify or delete the audit log archive through any available access path.
10.6 Non-Functional Considerations
Audit log volume and SIEM ingestion cost: Portainer audit event volume is a function of deployment scale, automation activity, and GitOps reconciliation frequency. A reference estimate for sizing: a 50-environment deployment with active GitOps reconciliation (5-minute polling interval) and daily CI/CD deployments generates approximately 50,000–150,000 events per day. Automated pipelines — reconciliation events, policy audit results, registry pull events — constitute the majority of event volume; human-initiated events are a small fraction. For SIEM platforms with ingestion-volume pricing (Splunk, Sentinel), use the dedicated portainer_audit index or PortainerAudit_CL custom table to isolate Portainer event volume for cost attribution. Apply log-level filtering at the Fluentbit or Logstash layer to suppress repetitive low-value events (e.g., GitOps reconciliation events with no change detected) before SIEM ingestion, while preserving all security-relevant events without exception.
Log forwarding reliability and buffering: Security audit log pipelines require at-least-once delivery guarantees — dropped events create compliance gaps and may be indistinguishable from deliberate tampering during an investigation. Configure Fluentbit with a persistent queue ( storage.type filesystem ) and an appropriate buffer size to absorb SIEM backpressure without silent record loss. Set storage.pause_on_chunks_overlimit On to apply backpressure upstream rather than dropping records when the buffer reaches capacity. For Portainer syslog forwarding, use TCP or TCP+TLS transport (not UDP) to detect forwarding failures and enable retransmission at the transport layer. Monitor the Fluentbit metrics endpoint for buffer exhaustion and retry count as first-class operational alerts in the Chapter 9 observability stack.
Encryption in transit: All Portainer audit log forwarding paths must encrypt data in transit without exception. Portainer syslog forwarding supports TCP+TLS and mTLS (see section 10.3 for the full CLI flag reference). Fluentbit-to-SIEM connections must use TLS with server certificate verification enabled; do not disable certificate verification outside explicitly documented and time-bounded break-glass scenarios. For Sentinel ingestion via the Log Analytics DCE endpoint, TLS is enforced by the Azure platform. For Elasticsearch and OpenSearch ingestion, configure the HTTP output plugin with TLS and supply the CA certificate bundle for server verification.
Immutable log storage: Write-once, tamper-evident log storage is required to satisfy the log integrity controls in section 10.5 and to ensure that a compromised management cluster cannot be used to delete audit evidence. Implement immutability at the storage layer rather than relying solely on the SIEM layer: S3 Object Lock in COMPLIANCE mode (not GOVERNANCE mode, which allows bucket owner override) with a retention period matching the longest applicable compliance framework requirement; Azure Blob immutability policy with policy lock enabled; GCS Object Hold for GCP environments. SIEM platforms may offer append-only index configurations as a supplementary control, but storage-layer immutability is the authoritative tamper-evidence mechanism. Document the immutability configuration, verify it annually, and include it in the compliance evidence package.
Air-gapped SIEM integration: For deployments where the Portainer management cluster has no outbound connectivity to a cloud-hosted or externally reachable SIEM, audit integration requires an on-premises SIEM instance or a batch export mechanism. Supported patterns: (1) on-premises Splunk or Elasticsearch instance receiving Portainer syslog events directly on the internal network; (2) Fluentbit with a filesystem buffer accumulating events for periodic batch export to removable media or a DMZ transfer point; (3) a one-way data diode appliance forwarding syslog events from the secure zone to a SIEM in the less-restricted zone. For air-gapped environments, establish and document a maximum acceptable event latency between generation and SIEM availability — typically 24 hours for batch export pipelines — and validate that this latency is acceptable for the applicable compliance framework and the incident response SLA defined in Chapter 9.
Scenarios
Portainer audit logs are stored locally in the embedded BoltDB instance only. No syslog forwarding is configured. Authentication and activity logs are accessible only through the Portainer UI, visible to platform administrators with direct access. There is no log retention policy beyond Portainer’s local database, no tamper protection, and no detection rules. Security events can only be investigated reactively by querying the Portainer UI directly. Only acceptable for production environments without compliance requirements. Any cluster serving business-critical production traffic or handling sensitive data should be at Level 2 or higher before going live.
Portainer syslog forwarding ( --syslog-address , --syslog-protocol tcp+tls ) is configured to deliver audit events to a basic log aggregation platform — Syslog-NG, a simple Loki instance, or Elasticsearch without the Security module. Log retention is configured (30–90 days) and satisfies basic evidence requirements. There are no active detection rules, no cross-source correlation, and no SIEM-grade alert routing. Security investigations are manual: operators query stored logs when an incident is suspected. The Kubernetes API server audit log is not yet collected. Appropriate for non-regulated environments where basic log retention is the requirement, or as an intermediate stepping stone before deploying a full SIEM. Enables audit evidence collection with minimal operational overhead.
Teams with open-source requirements or commercial SIEM licensing constraints use Wazuh as the SIEM platform. Wazuh is deployed centrally on the management cluster or on dedicated infrastructure. Two primary audit streams are forwarded to Wazuh via Fluent Bit: the Portainer Control Plane audit log (syslog forwarding), covering every action taken through Portainer, and the Kubernetes API server audit log, covering kubectl and service account operations that bypass Portainer entirely. These two streams together provide comprehensive control plane coverage and are sufficient for standard deployments and compliance reporting.
The Wazuh agent is deployed on each cluster node, adding host-level file integrity monitoring (FIM) — monitoring critical paths such as /etc/kubernetes , container runtime socket files, and kubeconfig locations — and process activity detection. Node journal/syslog collection provides OS-level activity visibility alongside the control plane streams.
Wazuh ships with detection rules pre-mapped to MITRE ATT&CK and compliance dashboards covering CIS Kubernetes Benchmark, PCI-DSS, SOC 2, and HIPAA — eliminating the rule authorship required when onboarding Portainer events to Splunk or Elastic Security. Portainer audit events are decoded by Wazuh’s field extraction framework to surface username, action, resource, and result for detection rule matching. This makes Wazuh the recommended SIEM choice for environments where Splunk, Sentinel, and Elastic Security are excluded by licensing, cloud dependency, or cost constraints. For the full three-stream posture adding Falco runtime security events, see Scenario E.
Portainer syslog forwarding targets a Fluentbit instance on the management cluster, which forwards the Portainer audit log stream to the Splunk HTTP Event Collector (HEC) endpoint over HTTPS with HEC token authentication and TLS. Portainer events are written to a dedicated Splunk index ( portainer_audit ) with Sourcetype set to portainer:audit , enabling field extraction and CIM mapping at index time. The CIM field mapping described in section 10.3 allows Portainer events to participate in Splunk Enterprise Security (ES) correlation searches and risk-based alerting alongside other data sources, without bespoke parser development for common detection patterns. Detection rules for the six primary use cases (section 10.4) are authored as Splunk ES correlation search rules, each mapped to a MITRE ATT&CK technique ID for automatic Notable enrichment and SOC triage context. Where Falco is deployed for advanced runtime security (section 10.2), Falco events from managed clusters reach Splunk via the same Fluentbit pipeline under a separate Sourcetype, enabling correlation between management-plane and runtime event streams within a single ES investigation timeline. The HEC token is stored in the platform's secret management layer (Chapter 8) and rotated on the platform credential rotation schedule.
Supplemental — Microsoft Sentinel (Azure variant of Level 4)
Azure enterprises operating the Microsoft security stack integrate Portainer into Microsoft Sentinel via a Data Collection Rule (DCR) pipeline. Portainer syslog events are received by Fluentbit on the management cluster, transformed to JSON, and forwarded to the Log Analytics DCE endpoint, where they are ingested into a custom table PortainerAudit_CL . The critical advantage is Entra ID identity correlation: Portainer authentication events include the user's Entra ID UPN, enabling join queries against SigninLogs in Sentinel to correlate Portainer administrative actions with Entra ID identity risk signals (conditional access policy failures, risk elevation, sign-in anomalies) — the cross-source correlation that makes Sentinel the natural SIEM for organisations whose IdP integration follows Chapter 4's OIDC model. Scheduled Query Rules in KQL target the PortainerAudit_CL table and generate Sentinel Incidents for PAM event types (break-glass access, exec sessions, Administrator role assignments), routing them directly to the SOC analyst case queue rather than the platform engineering on-call. Microsoft Defender for Containers provides Kubernetes API server audit log events alongside Portainer events in Sentinel, completing management-plane and cluster-plane visibility without separate log routing configuration.
Supplemental — Elastic Security / OpenSearch (OSS variant of Level 4)
Organisations running Elastic Security receive Portainer audit events via Fluentbit's Elasticsearch output plugin, writing to a dedicated index pattern ( portainer-audit-* ) managed by an ILM policy with hot, warm, and cold phases aligned to the applicable compliance retention requirement (section 10.5). ECS field mapping allows Portainer events to participate in Elastic Security's prebuilt detection rules, which match on ECS-standard fields such as event.action , user.name , and source.ip across all ingested sources. Custom query rules targeting portainer-audit-* are authored for the six detection use cases in section 10.4, each mapped to a MITRE ATT&CK technique. Where Falco is deployed for advanced runtime security (section 10.2), Falco events from managed clusters are ingested into a separate index pattern ( falco-events-* ) with consistent ECS field naming, enabling Elastic Security’s timeline view to correlate Portainer exec events and Falco shell spawn events on the same pod within a single investigation context. For organisations preferring a fully OSS SIEM, OpenSearch Security Analytics with Wazuh provides an equivalent capability without commercial licence dependency — the ECS-aligned field naming minimises rule re-authoring effort if platforms are migrated.
The full security posture: three independent audit streams forwarded to the SIEM simultaneously — Portainer Control Plane audit log, Kubernetes API server audit log, and Falco runtime security events (eBPF syscall monitoring). This is the configuration required for regulated environments with active SOC operations, environments processing cardholder data (PCI-DSS) or ePHI (HIPAA), and any deployment where a sophisticated attacker’s actions must be traceable across control-plane, API, and container-runtime layers simultaneously.
Each stream covers a different attack surface that the others cannot observe: the Portainer audit log records who did what through the Control Plane; the Kubernetes API server audit log records kubectl and service-account operations that bypass Portainer entirely; Falco records what happened inside running containers at the syscall level — shell spawns, sensitive file reads, unexpected network connections — after admission control has passed and below the API layer. The critical correlation pattern: a Portainer exec event in the Control Plane audit stream followed by a Falco shell-spawn alert on the same pod within a short time window constitutes a high-confidence indicator of compromise. Neither stream alone closes the detection gap. Correlating all three streams is the unique capability of Level 5.
All six primary detection use cases (section 10.4) are fully implemented with MITRE ATT&CK technique mapping. PAM events (break-glass access, exec sessions, Administrator role assignments) route to the SOC analyst on-call, not the platform engineering on-call, and generate SIEM investigation cases rather than operational incidents. Write-once SIEM storage (S3 Object Lock in COMPLIANCE mode, or Azure Blob immutability with policy lock enabled) provides tamper-evident log archives outside the administrative boundary of the Portainer management cluster. Compliance dashboards cover the applicable framework requirements (CIS Kubernetes Benchmark, PCI-DSS, SOC 2, HIPAA). Any enterprise SIEM — Wazuh, Splunk, Sentinel, Elastic Security — is viable at this level; the defining characteristic is the three-stream architecture and the correlated detection ruleset, not the backend platform.
Supplemental — Legacy SIEM (syslog integration for QRadar, ArcSight, FortiSIEM)
Enterprises operating traditional SIEM platforms (IBM QRadar, ArcSight, FortiSIEM) that do not natively consume Prometheus, Elasticsearch, or cloud-native log APIs use Portainer's syslog forwarding as the integration mechanism. Portainer is configured to forward audit events to the SIEM's syslog listener using TCP+TLS transport with RFC 5424 structured format (RFC 3164 for legacy platform compatibility). For platforms requiring CEF format, a Logstash pipeline between Portainer's syslog endpoint and the SIEM translates RFC 5424 structured fields to CEF header and extension field conventions. The syslog credentials and certificate material are stored in the platform's secret management layer (Chapter 8). Legacy SIEM platforms typically require custom parser development to extract Portainer-specific fields; mapping to the SIEM vendor's existing normalisation schema — rather than introducing a separate Portainer-specific schema — enables participation in the platform's built-in correlation rules. For regulated enterprises with a SIEM already certified for their compliance framework (PCI-DSS, HIPAA, FedRAMP), routing Portainer events into the certified SIEM rather than introducing a new tool is the lower-risk path to demonstrating compliance coverage across the container management control plane.
Key Decisions Addressed
- Ch10-D-01 — Two Primary Audit Streams Are Required; Falco Is Optional: A complete SIEM pipeline requires two streams: the Portainer Control Plane audit log and the Kubernetes API server audit log (direct kubectl and service account access that bypasses Portainer). These two streams together provide comprehensive control-plane coverage and are sufficient for standard deployments and compliance reporting. Falco adds a third optional stream — workload-level syscall anomalies — appropriate for high-security environments, regulated workloads requiring behavioural detection, or organisations with active SOC operations. — see section 10.2
- Ch10-D-02 — SIEM Forwarding Is Non-Optional for Regulated Environments: Portainer stores audit logs in an embedded bboltDB instance that is not inherently tamper-evident. The authoritative audit record must be the SIEM copy, not the Portainer-local copy. SIEM forwarding must be configured before the platform enters production — retroactive setup creates an irrecoverable gap in the audit record. — see section 10.2
- Ch10-D-03 — SIEM Platform Selection: Four integration patterns are supported. Splunk for enterprises with existing Splunk ES investment. Microsoft Sentinel for Azure/Microsoft stack environments requiring Entra ID identity correlation. Elastic Security for OSS-friendly, engineering-led teams. Wazuh for open-source-only environments — it provides compliance dashboards, host-based monitoring (FIM), and MITRE ATT&CK rule mapping without commercial licence dependency and is the CNCF reference stack choice. — see section 10.3
- Ch10-D-04 — Dedicated Index or Table per SIEM: Portainer audit events must be written to a dedicated index, table, or index pattern in the SIEM, separate from infrastructure logs. This enables targeted retention policies aligned to the applicable compliance framework, RBAC restricting query access to SOC analysts and auditors, and cost attribution in volume-priced SIEM platforms. — see section 10.3
- Ch10-D-05 — Immutable Log Storage Outside the Administrative Boundary: Audit logs must be routed to a write-once storage layer outside the administrative boundary of the Portainer management cluster. A Portainer Administrator with kubectl access must not be able to modify or delete the audit log archive. Use S3 Object Lock in COMPLIANCE mode (not GOVERNANCE mode, which allows bucket owner override), Azure Blob immutability with policy lock enabled, or GCS Object Hold. — see section 10.6
- Ch10-D-06 — At-Least-Once Delivery with Persistent Buffer: Log forwarding pipelines must guarantee at-least-once delivery. Configure Fluent Bit with a persistent filesystem queue and backpressure handling to absorb SIEM backpressure without silent record loss. Use TCP or TCP+TLS syslog transport (not UDP) for all forwarding paths to detect failures and enable retransmission. Monitor buffer exhaustion and retry rate as operational alerts. — see section 10.6
- Ch10-D-07 — TLS and mTLS on All Forwarding Paths: The Portainer syslog integration defaults to UDP on port 514 — this must be overridden to --syslog-protocol tcp+tls for all production and regulated deployments. For mutual authentication, supply --syslog-cert , --syslog-key , and --syslog-ca-cert . Never set --syslog-insecure-skip-verify true outside testing. Fluent Bit-to-SIEM connections must also use TLS with server certificate verification enabled. — see section 10.3
- Ch10-D-08 — MITRE ATT&CK Technique Mapping on All Detection Rules: Every detection rule authored against Portainer audit events must map to a MITRE ATT&CK technique in the rule metadata. This enables automatic technique tagging on SIEM incidents, supports SOC triage context, and allows detection coverage gaps to be identified by mapping existing rules against the ATT&CK matrix. — see section 10.4
- Ch10-D-09 — PAM Events Route to SOC, Not Platform Engineering: Break-glass access events, exec sessions to production workloads, and Administrator role assignments must generate SIEM investigation cases routed to the SOC analyst on-call, not the platform engineering on-call. These events represent potential security incidents and require the appropriate investigation response, not operational incident management. — see sections 10.2 and 10.4
- Ch10-D-10 — Falco Is an Optional Component for Advanced Runtime Security: Falco is not required in the standard deployment. It should be adopted by organisations requiring workload-level syscall monitoring beyond what the Portainer and Kubernetes API server audit logs provide — high-security environments, regulated workloads with behavioural detection requirements, or active SOC operations. When adopted, Falco is deployed as a DaemonSet per cluster via Portainer’s GitOps integration, and its events must be forwarded to the same SIEM as the Portainer audit log to enable exec-to-shell-spawn correlation. — see section 10.2