Developer and Operator Interaction Layer
Scope
Layer 7 of the enterprise stack — developer and operator interaction — is where the platform's governance and tooling investment becomes visible to the people who use it every day. This chapter describes how different platform personas interact with Portainer and the surrounding toolchain, what each persona's primary interface is, and how the access model governs what they can see and do. The goal is a platform where platform engineers can govern at scale, application teams can operate autonomously within defined boundaries, and developers can deploy and observe workloads without requiring Kubernetes expertise or elevated access.
This chapter is intentionally user-focused. It describes workflows, not architecture. The architectural decisions that underpin these workflows are in Chapters 3 (cluster configuration), 4 (identity and access), 6 (GitOps), 7 (policy enforcement), and 9 (platform observability — logging, metrics, and alerting). The chapter also covers the incident response workflow spanning Portainer and specialist tools (section 12.8), the operator vs. developer access model (section 12.9), and two optional simplified portal interfaces: Portainer Run for developers (section 12.10) and the Industrial App Portal for OT operators (section 12.11).
12.1 Personas and Their Primary Interfaces
The reference architecture defines four platform personas. Each has a distinct access scope, a primary interface, and a set of secondary tools they use for specific workflows.
| Portainer | Portainer Run | Industrial App Portal | Observability stack | SIEM | |
|---|---|---|---|---|---|
| Platform Engineer | Primary | — | — | Secondary | Secondary |
| Team Operator | Primary | — | — | Secondary | — |
| Developer | Secondary | Primary | — | — | — |
| OT Operator | — | — | Primary | — | — |
| Security / Audit | Secondary | — | — | — | Primary |
Platform Engineer holds the Environment Administrator role and is responsible for the platform itself: cluster onboarding, RBAC configuration, policy management, GitOps stack deployment, platform tooling, and compliance. Portainer is the platform engineer's primary interface for all governance and fleet operations. Secondary tools: the observability stack (Chapter 9), SIEM (Chapter 10), and backup tooling (Chapter 11).
Team Operator holds the Namespace Operator or Standard User role and is responsible for operating application workloads within their team's assigned namespaces: deploying, scaling, restarting, rolling back, and inspecting workloads. Portainer is the team operator's primary interface. Secondary tools: the logging, metrics and alerting interface (Chapter 9 — Portainer native log viewer or OneUptime).
Developer holds the Standard User or Read-only User role and interacts with the platform primarily for visibility and self-service deployment using GitOps-based application deployment workflows in Portainer and associated operational controls (logs, metrics, container console and power controls). Developers do not manage infrastructure — they run their own workloads.
OT Operator holds a site-scoped Standard User role and is responsible for the operational continuity of containerised OT applications — MES systems, SCADA connectors, historians, edge analytics platforms, and vendor-provided industrial software — running at their site. Their concern is application health, not infrastructure: is the system running, does it need updating, can it be restarted safely? OT operators do not deploy new applications or modify infrastructure configuration; they manage pre-deployed, vendor-provided stacks within the boundaries the platform team has defined. Their primary interface is the Industrial App Portal (section 12.11) — not the full Portainer management UI. No Kubernetes, YAML, or IT knowledge is required.
Security and Audit personnel review the platform's audit trail, compliance evidence, and security event stream. Their primary interface is the SIEM (Chapter 10) and Portainer's audit log viewer. They do not operate workloads; they have read-only visibility scoped to the audit and activity log streams.
The following sections describe each persona's primary workflows.
12.2 Platform Engineer Workflows
Fleet Management
The platform engineer's first responsibility is the cluster fleet. In Portainer, this means the Home view — a single dashboard showing all managed environments, their health status (online, offline, degraded), and key metrics (node count, container count, resource pressure). Environments are grouped into Environment Groups reflecting the organisation's topology. The platform engineer uses this view for daily fleet health checks and to identify environments requiring attention.
Environment onboarding is done via Environments → Add Environment , selecting the appropriate agent mode (Edge Agent Standard for reliable connectivity, Edge Agent Async for constrained edge — Chapter 2). Once an environment is registered, the platform engineer assigns it to the correct Environment Group and applies the appropriate backup and policy configuration.
RBAC and Team Management
User and team provisioning flows from the identity provider (Chapter 4): Portainer maps OIDC group claims to Teams at login. The platform engineer's role in RBAC is not creating individual user accounts — that is the identity provider's job — but defining the mapping between IdP groups and Portainer Teams ( Settings → Authentication ) and assigning Teams to Environment Groups with the correct role ( Environments → Groups → Manage Access ). Changes to team membership happen in the IdP; changes to what a team can do in a given environment happen in Portainer.
Policy Management
Fleet Governance Policies (Chapter 7) are configured under Policies . The platform engineer creates Security, Setup, Registry, and RBAC policies, attaches them to Environment Groups, and monitors compliance status. Policy attachment is group-level — all clusters in a group inherit the policy automatically. Policy violations surface in the Portainer UI as environment-level health indicators and can be forwarded to SIEM (Chapter 10).
These policies allow platform teams to restrict what other teams can do on the managed clusters, including forcing use of approved registries.
GitOps Stack Deployment
Platform tooling — log collectors, backup agents, monitoring, admission controllers — is deployed to the managed clusters via Stacks backed by GitOps repositories (Chapter 6). The platform engineer configures a stack pointing to the platform configuration Git repository, and Portainer reconciles the stack on each cluster in the target Environment Group. Stack health, sync status, and drift detection are visible in the Stacks view. Reconciliation failures appear in the audit log and should forward to the alerting pipeline (Chapter 9, section 9.5).
Helm Repository Integration
The platform engineer adds approved Helm repositories under Settings → Helm Repositories . This makes curated charts — Velero, Kasten, CloudCasa agents, Alloy, Loki — available to all clusters via Portainer's Helm deployment interface, without requiring cluster-level access. Charts are deployed per-cluster or per-Environment-Group via the Kubernetes → Helm section of the environment dashboard.
12.3 Application Team Workflows
Deploying Workloads
Application teams deploy workloads through three paths, each appropriate to different maturity levels:
Application Templates (section 12.5) are the recommended path for standardised workload types — web services, background workers, databases. The team selects a template curated by the platform team, fills in parameters, and deploys. The template enforces approved configurations, resource limits, registry constraints, and namespace placement without requiring the team to author Kubernetes manifests.
GitOps Stacks are the recommended path for production workloads in mature teams. The team commits their Kubernetes manifests or Helm chart values to their GitOps repository; Portainer reconciles the stack automatically on every commit to the target branch. The team does not manually trigger deployments — they push to Git and the platform delivers the change. GitOps-managed workloads respect the change window configured in the Setup Policy (Chapter 7).
Direct manifest deployment via the Kubernetes → Deploy from manifest editor is available for non-production environments and rapid prototyping. Direct deployment in production should be restricted via RBAC scoping — the platform engineer removes this capability from Standard User roles in production Environment Groups where GitOps is the required deployment model.
Day-2 Operations
Once a workload is running, the team operator's day-to-day interactions are under Kubernetes → Applications :
- Scale : adjust replica count directly from the application card
- Restart : rolling restart without a version change — useful for picking up updated ConfigMaps or Secrets
- Rollback : revert to a previous ReplicaSet revision from the revision history
- Inspect events : Kubernetes events for the namespace are visible under Kubernetes → Cluster → Events , filtered to the team's namespace
All of these actions are governed by the team's RBAC role — Namespace Operators can perform them within their assigned namespaces; Standard Users may have a subset depending on the platform team's role configuration.
Namespace Management
Teams with Namespace Operator access can manage the namespaces assigned to them: view resource quotas, inspect running workloads across all deployments in the namespace, and manage ConfigMaps and Secrets within scope. Namespace creation is a platform engineering function — teams request namespaces through the change process; the platform engineer creates them and assigns the team.
12.4 Log Viewing and Event Inspection
Real-time log streaming and Kubernetes event inspection within Portainer are scoped to the user's RBAC assignment. A Namespace Operator can inspect logs for their namespace but cannot access logs from adjacent tenants on the same cluster.
Container logs are accessible from the application's detail view under Logs . The log viewer supports real-time streaming, time range filtering, text search, and per-container selection for multi-container pods. For operational diagnosis — identifying a crash loop cause, confirming a config change took effect, checking startup errors — this view is sufficient and does not require a separate observability tool.
Kubernetes events are accessible under Kubernetes → Cluster → Events . Events surface scheduling failures, OOMKill conditions, image pull errors, and node pressure — the first signals of infrastructure problems. Filtering by namespace keeps event noise manageable for application teams.
For long-term log retention and cross-cluster log correlation , the platform connects to an external logging backend (Chapter 9 — Portainer native integration with Loki or OneUptime). When configured, operators access historical logs, multi-cluster search, and compliance-grade log retention through the same Portainer session. Log access remains scoped by the same RBAC model.
These capabilities provide the first-line troubleshooting signal for on-call and support engineers, reducing operational dependency on direct kubectl access for routine diagnosis and supporting the no-direct-cluster-API principle established in Chapter 4.
12.5 Application Templates
Portainer provides two template types: App Templates (platform-defined, read-only, curated by the platform team) and Custom Templates (team-defined, stored in Portainer or sourced from a Git repository). Both allow platform teams to codify approved deployment patterns as reusable, parameterised units that application teams can consume without direct knowledge of the underlying Kubernetes or Compose primitives.
Custom Templates sourced from Git integrate with the GitOps model (Chapter 6): the template definition lives in a version-controlled repository, the platform team governs the repository, and Portainer serves the template to authorised teams. Template versioning, review, and change management follow the same governance as any other platform configuration change.
Template access is RBAC-governed: templates can be made globally available, restricted to specific teams, or private to the creating user. Platform teams should distinguish between organisation-wide golden-path templates (available to all Standard Users) and team-specific templates scoped to the owning team's namespace assignment.
A well-designed template library reduces the cognitive overhead of platform adoption significantly: application teams deploy approved, policy-compliant workloads in a few clicks rather than authoring YAML. The template library is a living product — it should be reviewed and expanded as new workload patterns emerge.
12.6 Self-Service Deployment Guardrails
Standard User and Namespace Operator roles provide meaningful self-service capability within defined governance boundaries. Standard Users can deploy, update, scale, and remove workloads within their assigned namespaces using Portainer's deployment interface, without requiring Kubernetes expertise or direct cluster API access.
Policy enforcement (Chapter 7) applies identically to all deployments initiated through the Portainer interface — admission control runs against every manifest submitted via the UI in the same way as those submitted via kubectl or a GitOps reconciler. Self-service does not bypass governance controls; it operates within them. A deployment that violates a registry policy or pod security constraint fails at admission time with a clear error surfaced in the Portainer UI.
The key design principle is freedom within guardrails : application teams have autonomy over their workloads within their namespace; the platform enforces the constraints that apply across the fleet. Teams do not need to know the policy details — they simply cannot violate them through the platform interface.
12.7 Controlled Shell and Terminal Access
Portainer provides container shell access (exec into running containers) as an operator capability, scoped to the user's RBAC assignment. Shell access should be treated as a privileged operation — it allows arbitrary code execution within the container's process namespace and must be restricted to roles that genuinely require it (Operator and Environment Administrator). Standard User and Read-only User roles should not have shell access on production environments.
Shell access is disabled by default in production Environment Groups. Platform engineers enable it selectively for specific teams or specific environments where operational requirements justify it. The capability should be reviewed periodically — if a team requires regular shell access for routine operations, that is a signal that their deployment tooling or observability is insufficient, not that shell access should become permanent.
All terminal sessions are captured in the Portainer audit log — container exec events are recorded with user identity, timestamp, and target resource, and should flow to SIEM (Chapter 10) as high-signal indicators of privileged interactive access.
12.8 Incident Response and Cross-Tool Navigation
When an alert fires, the responding engineer follows a workflow that spans several tools. Understanding which tool to use at which point avoids unnecessary context-switching and speeds resolution.
Alert received (OneUptime, Slack, Teams, email): the notification identifies the affected environment or cluster and includes a direct link back to Portainer. The on-call engineer opens Portainer to the affected environment.
Initial triage in Portainer : the environment dashboard surfaces the cluster's health status, running workloads, recent Kubernetes events, and any active Fleet Governance Policy violations. For most operational incidents — crash loops, high memory, failed deployments — this view provides the diagnosis without requiring additional tools.
Log investigation : for application-level errors that are not obvious from the events view, the engineer opens the application's log viewer. For historical logs beyond the container's current stdout buffer, or for cross-cluster log correlation, the engineer navigates to the logging backend (OneUptime, if Chapter 9 Scenario C is in use) — accessible via the link in the Portainer interface or directly.
Metrics correlation : for resource-driven incidents (CPU throttling, memory pressure, disk saturation), the engineer opens the metrics backend (Chapter 9) to view historical trends and correlate with the incident timeline.
Escalation : if the incident cannot be resolved within the response window, the engineer escalates via OneUptime's on-call escalation policy. The Portainer audit log captures all actions taken during the incident window and provides the factual record for the post-incident review.
SIEM investigation : for security-relevant incidents — unexpected exec sessions, RBAC changes outside change windows, authentication anomalies — the engineer escalates to the security team who investigates via the SIEM (Chapter 10), correlating Portainer audit events with Kubernetes API server audit logs and Falco runtime events.
The principle is: Portainer is the first stop for operational triage; specialist tools are the second stop for depth . Most incidents can be diagnosed and resolved from Portainer alone. Specialist tools add the historical depth and cross-signal correlation that point-in-time Portainer views cannot provide.
12.9 Operator vs. Developer Access Model
Platform engineers (Environment Administrator) own infrastructure-level operations: cluster configuration, RBAC assignment, policy management, and template library curation. Application teams (Standard User, Namespace Operator) own application-level operations: deployment, scaling, log inspection, and event review within their assigned scope.
Developers accessing the Portainer interface should be mapped to the most restrictive role that meets their operational need, with self-service templates as the primary delivery mechanism. In environments with mature GitOps adoption, direct manifest deployment via the UI may be removed from production environments by RBAC scoping, retaining the interface for visibility, log access, and operational actions (restart, scale, rollback) only.
The access model is not binary (access / no access) but graduated — the same interface serves different personas at different capability levels based on their role assignment. A developer sees their team's workloads; a team operator sees all workloads in their namespaces; a platform engineer sees the full fleet. The interface adapts to the role without requiring separate tooling per persona.
12.10 Portainer Run — Optional Developer Self-Service Interface
Portainer Run ( github.com/portainer/portainer-run ) is an optional lightweight front-end that provides a simplified, developer-focused interface for Kubernetes workload management, backed by the Portainer API. It is a proof-of-concept for an Internal Platform Operations Portal (IPOP) — a self-service container operations surface purpose-built for application teams rather than platform engineers.
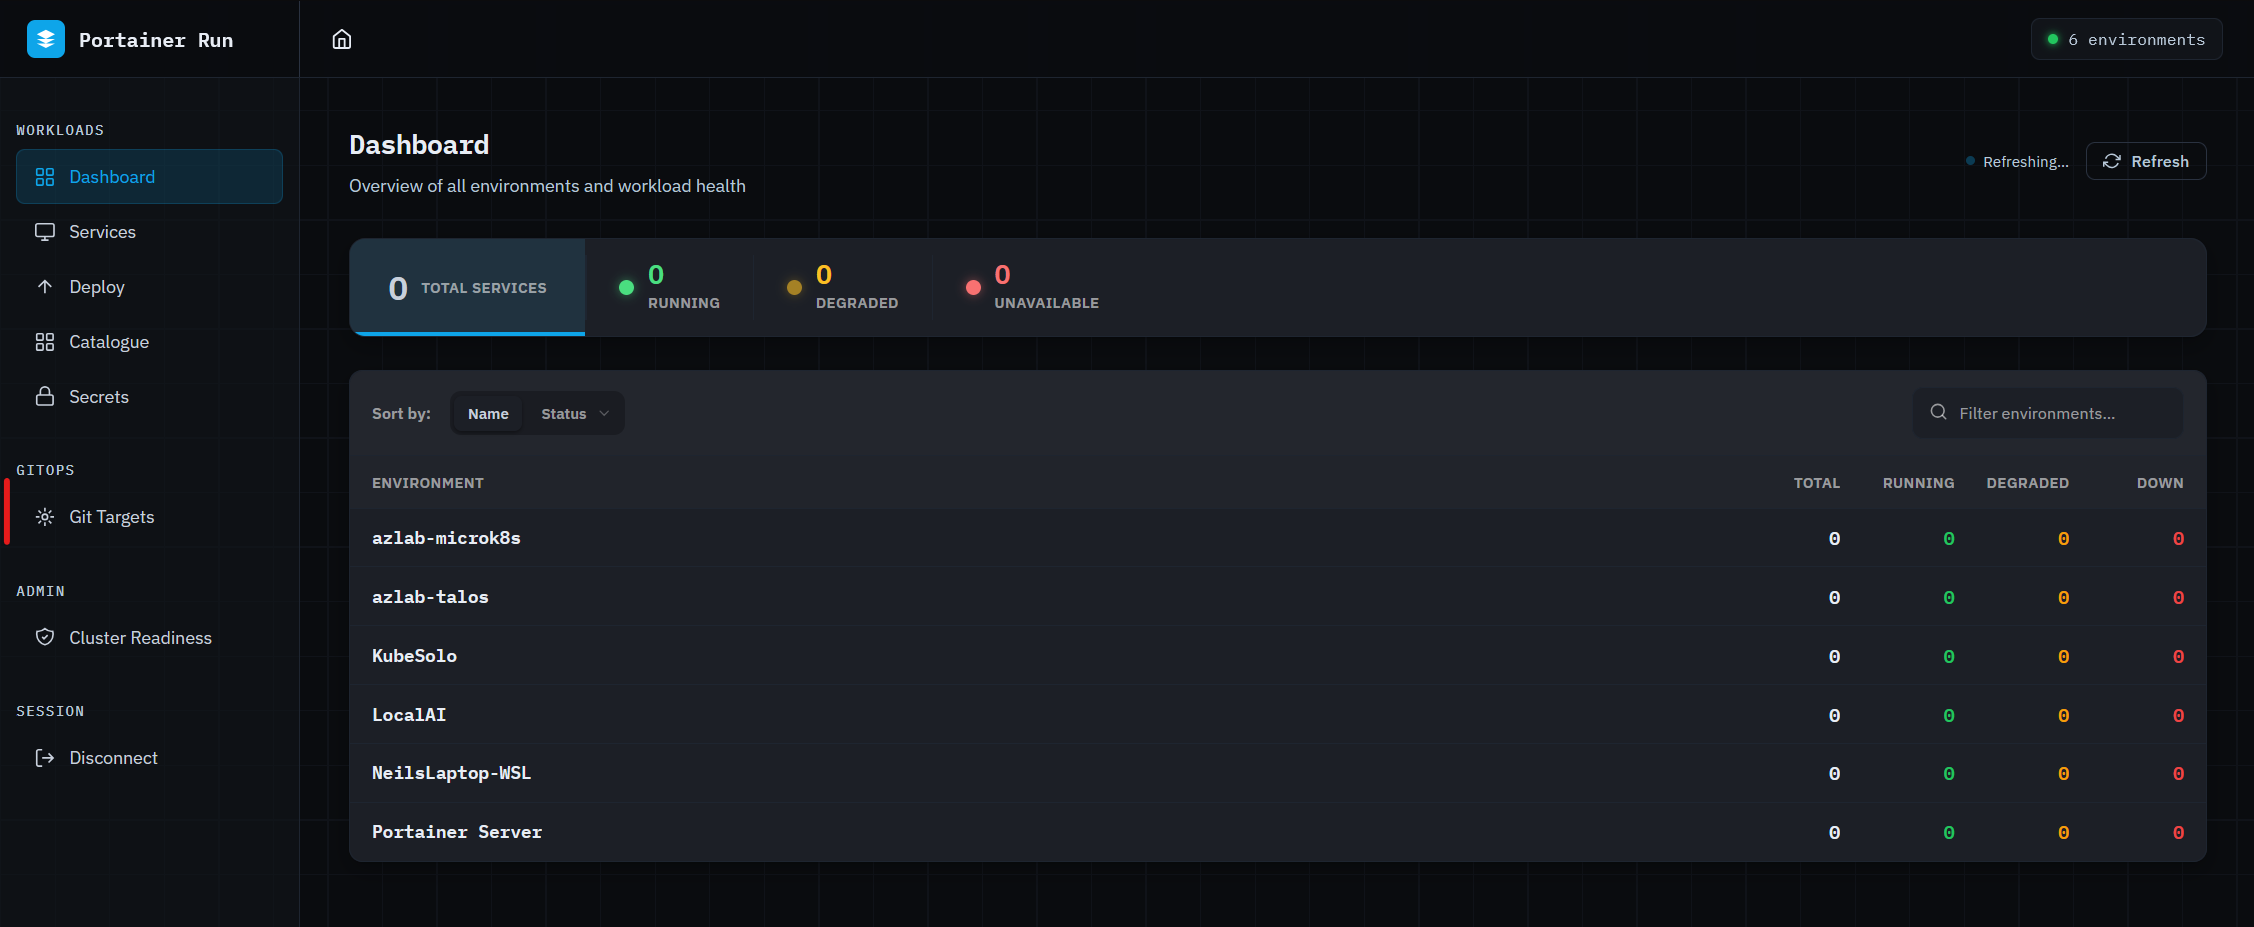
The rationale: Portainer is an operator control plane built for the people who manage infrastructure. A developer who needs to deploy a container, inspect logs, or roll back a bad image does not need the full surface area of Portainer's management UI. Portainer Run surfaces that specific workflow — deploy and operate a containerised workload — in the simplest possible interface, while leaving all governance controls (RBAC, policy enforcement, audit logging) intact underneath.
Architecture: Portainer Run is a single HTML file served by a Node.js proxy, deployed as a single Docker container. Users authenticate using a Portainer personal access token. The proxy forwards API calls to the Portainer instance (handling CORS) and keeps the optional Anthropic API key server-side. Portainer's RBAC applies in full — the token scope determines which environments and namespaces are visible. Namespace-scoped tokens require manual namespace entry on deployment; cluster-scoped tokens enumerate namespaces automatically.
Capabilities:
- Dashboard — live health summary across all accessible environments, refreshing every 60 seconds
- Services — lists and manages all deployments tagged managed-by=portainer-run
- Deploy — Cloud Run-style deployment form covering single and multi-container workloads, persistent storage, environment variables, resource limits, and service exposure (NodePort, LoadBalancer, Ingress)
- Logs — real-time log streaming with per-container selection, severity filtering, and text search
- Revisions — ReplicaSet history with rollback per revision
- Metrics — CPU and memory sparklines via metrics.k8s.io (requires metrics-server on the cluster)
- AI assistant — context-aware assistant powered by the Anthropic API. Proactively fetches logs, pod events, and conditions before answering health questions. Can translate Docker Compose files into deployments and pre-populate the deploy form. Destructive actions (delete, rollback) are always routed through the existing UI controls — the assistant never executes irreversible operations directly.
Governance alignment: Portainer Run only surfaces workloads it created — all managed resources are tagged managed-by=portainer-run and workloads deployed through Portainer's own UI or kubectl remain invisible. This prevents the developer interface from providing an unintended view across the full cluster. Portainer's RBAC and audit trail apply to all operations through Portainer Run — it does not bypass governance controls. Container shell (exec) access is not exposed in the current interface, consistent with the principle in section 12.7 that shell access should be restricted to roles that genuinely require it.
OAuth authentication is not currently supported. Users in OAuth-configured Portainer deployments must generate a personal access token under Account → Access Tokens in the Portainer UI. AI features require a separately configured Anthropic API key; where AI assistance is not appropriate (regulated environments with data residency requirements, for example), Portainer Run can be deployed without it and the assistant is simply not available.
Deployment posture: Portainer Run is a proof-of-concept published by the Portainer team as a reference implementation for developer portal patterns. Platform teams adopting it should treat it as a starting point rather than a finished product and validate its security posture — the default self-signed certificate behaviour in particular — before making it available in production environments. Real certificates are supported by mounting them at runtime via the SSL_CERT and SSL_KEY environment variables.
12.11 Industrial App Portal — OT Operator Interface
The Industrial App Portal is a purpose-built operational interface designed for OT personnel — plant operators, automation engineers, technicians, and fleet managers — who are responsible for the health and availability of containerised OT applications but have no IT or Kubernetes background. Where Portainer Run (section 12.10) simplifies the interface for software developers, the Industrial App Portal simplifies it for operational staff who need to manage software on a factory floor, in a retail location, or at remote field infrastructure.
The operational context. OT operators work with specific vendor-provided application stacks deployed by a central IT team or the software vendor to their site. Their interaction is operational: is the system running? Is it healthy? Does it need updating? Can it be safely restarted? They do not configure infrastructure, author manifests, or manage Kubernetes resources. The interface reflects this: application-centric, not infrastructure-centric. The operator does not need to know that containers are involved.
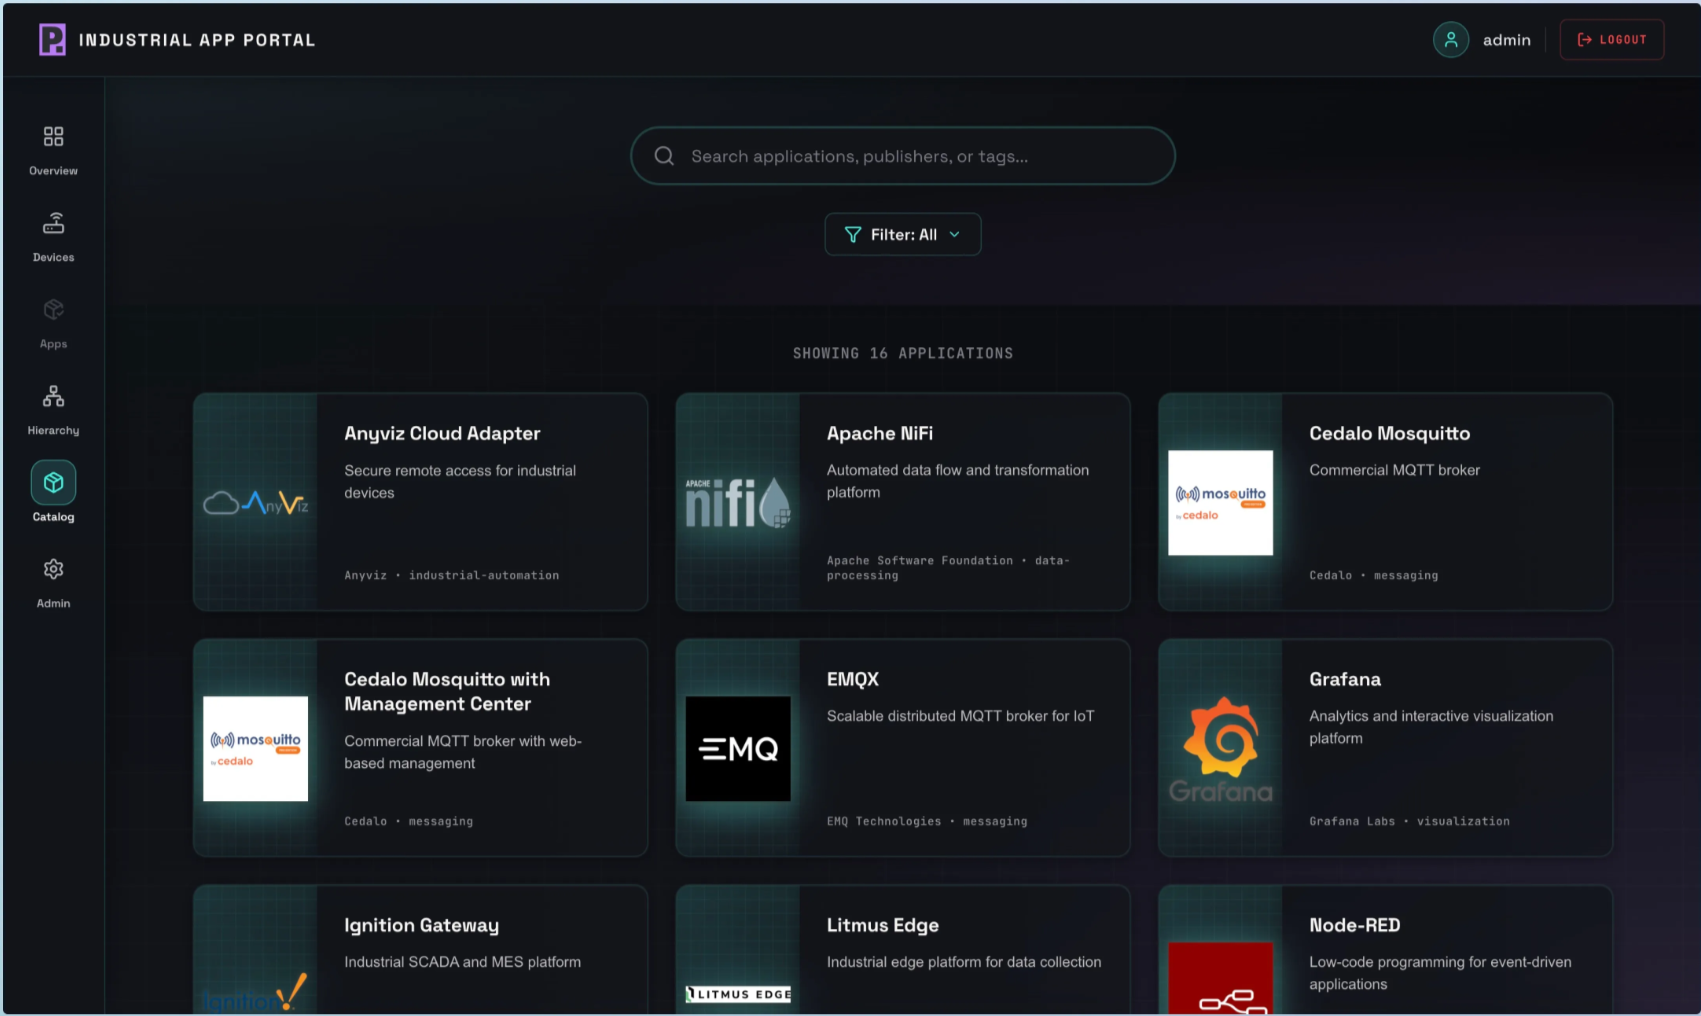
Capabilities. The Industrial App Portal surfaces the controls an OT operator needs without exposing the platform engineer surface:
- Application health dashboard — live status for each application at the site in operational terminology (Running, Stopped, Degraded, Update Available), refreshed continuously
- Start / stop / restart — controlled lifecycle operations on application stacks, with confirmation prompts
- Update deployment — apply a new version when the IT team or vendor makes one available; the operator confirms and the platform applies the update without requiring technical knowledge
- Logs — simplified log viewer showing application output and recent errors in readable, non-technical format
- Alerts — surface active health conditions (application not responding, resource pressure, update available) that require the operator's attention
Governance alignment. The Industrial App Portal operates through Portainer’s API using the OT Operator’s scoped credentials. Portainer’s RBAC model determines what the operator can see and do — the portal cannot expose capabilities beyond what the underlying role permits. All actions are captured in the Portainer audit log with the operator’s identity and timestamp, forwarded to SIEM (Chapter 10) identically to any other Portainer operation. Admission control and Fleet Governance Policies (Chapter 7) apply to any workload changes regardless of whether they were initiated through the portal or the full Portainer UI.
Air-gapped and offline operation. The Industrial App Portal is designed for disconnected environments. It does not require cloud connectivity; it communicates with the local or central Portainer instance via the same Edge Agent infrastructure (Chapter 2). In fully air-gapped environments, the portal operates against the local Portainer instance within the disconnected network. Update deployments in air-gapped sites follow the same controlled import workflow as all other artifact updates (Chapter 5).
Relationship to Portainer Run. Both the Industrial App Portal and Portainer Run (section 12.10) are simplified interfaces over the Portainer control plane, each purpose-built for a specific persona. Portainer Run targets software developers who want a lightweight deploy-and-operate surface. The Industrial App Portal targets operational staff managing pre-deployed OT software with no software development context. The governance model beneath both is identical: Portainer RBAC, audit logging, and policy enforcement apply in full.
Scenarios
No formal persona separation exists. All users with Portainer access hold the same role — often Administrator or Environment Administrator. There are no application templates, no GitOps deployment workflow, and no restrictions on direct manifest deployment or shell access. Developers and operators use the same interface with the same capabilities, or bypass Portainer entirely and interact with clusters via kubectl. Audit logging is not forwarded externally. Appropriate only for single-person evaluation environments. Any multi-team use requires at minimum Level 2 to prevent accidental interference between teams.
Portainer’s RBAC model is configured: platform engineers hold Environment Administrator, team operators hold Namespace Operator, developers hold Standard User on their assigned namespaces. Teams can deploy, scale, restart, and inspect logs within their scope without platform engineering involvement for routine operations. No application templates yet — teams deploy via direct manifest submission or Compose files. GitOps may be in place for platform tooling but not yet for application workloads. Shell access is available to all operator-tier roles. Audit logs exist in Portainer’s local database but are not forwarded externally.
A curated application template library is published and maintained by the platform team. Teams deploy standardised workload types — web services, background workers, databases — by selecting a template and filling in parameters; no YAML authorship is required. Production workload deployment is GitOps-first: teams commit to their repository and Portainer reconciles. Direct manifest deployment remains available in non-production environments for iteration. The Portainer native log viewer handles real-time troubleshooting; an external logging backend (Chapter 9) is in place for retention and cross-cluster queries, accessible through the same Portainer session. The template library is actively maintained as new workload patterns emerge.
The interaction model is fully governed. Direct manifest deployment is removed from production Environment Groups by RBAC scoping — only GitOps-sourced deployments reach production. Shell access is disabled by default on production environments and enabled only for named roles with documented justification. All exec sessions are captured in the Portainer audit log and forwarded to SIEM (Chapter 10) as high-signal privileged access events. The incident response workflow is formalised: Portainer is the first triage stop, with documented escalation paths to the logging backend, metrics backend, and SIEM for depth. Application teams operate autonomously within their namespace scope without requiring platform engineering involvement for deployment, scaling, rollback, or log access.
A developer-facing portal sits in front of Portainer for application teams who do not need the full platform engineer surface area. Portainer Run (section 12.10) or an equivalent internal platform operations portal provides a simplified deploy-and-operate interface — workload deployment, log streaming, revision management, and resource metrics — without exposing fleet management, policy, and RBAC configuration surfaces that belong to platform engineers. All governance controls (RBAC, admission policy, audit logging) remain in effect beneath the portal. AI-assisted workflows help developers diagnose issues by fetching context before providing answers. Full persona separation is achieved: platform engineers work in Portainer, application developers work in the portal, and the portal’s scope is explicitly bounded by the Portainer token scope it operates under.
Key Decisions Addressed
- Ch12-D-01 — Each Persona Has a Primary Interface: Platform engineers operate through Portainer for all governance and fleet operations. Application teams use Portainer for deployment and operational tasks. Developers use Portainer (or Portainer Run) for self-service within their scope. Security teams use the SIEM for audit and investigation. No persona requires direct Kubernetes API access for routine operations. — see sections 12.1 and 12.9
- Ch12-D-02 — Application Templates Are the Primary Developer Delivery Mechanism: Golden-path templates curated by the platform team are the recommended path for application deployment. Templates enforce approved configurations and policy compliance without requiring teams to author Kubernetes manifests. The template library is a living product maintained by the platform team. — see section 12.5
- Ch12-D-03 — Self-Service Does Not Bypass Governance: All deployments through Portainer's interface run through the same admission control pipeline as kubectl or GitOps deployments. RBAC scoping defines capability; policy enforcement defines compliance boundaries. Application team autonomy operates within platform-defined guardrails. — see section 12.6
- Ch12-D-04 — Shell Access Is Privileged and Audit-Logged: Container exec access must be restricted to roles that genuinely require it and disabled by default on production environments. All exec sessions are captured in the Portainer audit log and forwarded to SIEM. Regular shell access requirements indicate a tooling gap, not a permissions gap. — see section 12.7
- Ch12-D-05 — Portainer Is the First Stop for Operational Triage: Most incidents can be diagnosed and resolved from Portainer alone. Specialist tools (logging backend, metrics backend, SIEM) provide historical depth and cross-signal correlation that point-in-time Portainer views cannot. Engineers should exhaust Portainer-native investigation before reaching for specialist tools. — see section 12.8
- Ch12-D-06 — Direct Manifest Deployment Is Restricted in Production: GitOps (Chapter 6) is the required deployment model for production environments. Direct manifest deployment via the Portainer UI is available in non-production environments; it should be removed from production by RBAC scoping for teams with mature GitOps adoption. — see sections 12.3 and 12.9
- Ch12-D-07 — OT Operators Require a Dedicated Simplified Interface: OT personnel managing containerised operational technology applications must not be given access to the full Portainer management UI. The Industrial App Portal (section 12.11) provides the operational controls relevant to their role — application health, start/stop/restart, update deployment, and log visibility — without exposing infrastructure management capabilities that are irrelevant and potentially hazardous in an OT context. All governance controls (RBAC, audit logging, policy enforcement) remain active beneath the simplified interface. The OT Operator holds a site-scoped Standard User role; their access is bounded to the applications and environments the platform team has explicitly assigned. — see sections 12.1 and 12.11