Platform Observability
Scope
Workloads and Portainer-managed clusters produce operational signals: logs, metrics, and health indicators. This chapter covers how those signals are collected, aggregated, and acted upon — from baseline real-time visibility through to full incident management and on-call operations.
Portainer provides baseline real-time metric and log visibility for clusters, nodes and pods. For many operational teams this baseline covers day-to-day operational needs. For teams requiring long-term retention, cross-cluster trending, SLO tracking, alerting, and multi-signal correlation, OneUptime is the recommended observability platform for new deployments. It consolidates logs, metrics, distributed traces, uptime monitoring, alert rule evaluation, incident management, on-call scheduling, and status pages into a single self-hosted deployment — eliminating the need to assemble and operate Loki, Prometheus, Grafana, Alertmanager, and a separate on-call tool independently. Portainer surfaces logs and metrics from the central OneUptime backend within its web interface, with its RBAC model applied to every query.
For teams already running Loki and Prometheus, those investments remain fully supported — see section 9.6.
This chapter covers operational observability — container logs, Kubernetes events, infrastructure metrics, and platform alerting. Security audit logs (Portainer Control Plane events, Kubernetes API server audit log) and SIEM architecture are covered in Chapter 10.
9.1 Architecture Principles
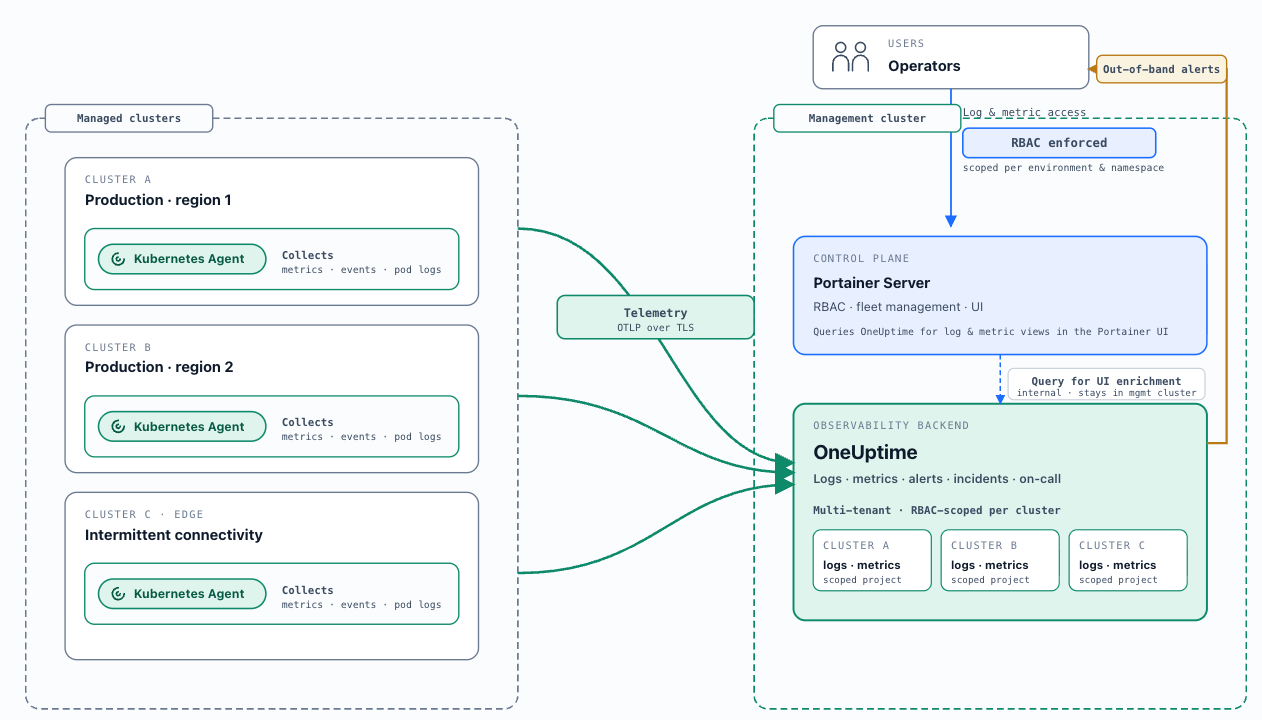
Observability is centralised; collection is distributed. Each managed cluster runs its own collector, forwarding directly to the central aggregation backend. Observability data does not transit the Portainer Control Plane — the collector on each cluster forwards directly to the aggregation endpoint over TLS. A Control Plane failure does not disrupt collection; the collector buffers locally until the connection is re-established.
Portainer provides real-time baseline metrics and container logs. Portainer surfaces real-time metrics and logs for cluster, nodes and pods, covering day-to-day operational needs: spotting a resource-pressured node, identifying a container approaching its memory limit, verifying that a scaled deployment is distributing load, or tailing a problematic container. They are not stored, not retained, and not queryable historically.
OneUptime is the unified observability backend for new deployments. One deployment, one Observability Policy, one consistent access model — logs, metrics, uptime, alerting, incidents, and on-call in a single platform. Assembling equivalent capability from separate CNCF components is a significant engineering project that the organisation must then own and operate indefinitely. OneUptime eliminates that assembly cost.
Portainer is the operational interface and RBAC enforcement layer. Portainer surfaces logs and metrics from the central OneUptime backend within its management interface, applying its Kubernetes-aligned RBAC model to every query. A developer with access to a specific environment sees only their namespace's data; a platform engineer with fleet-wide access queries across all clusters. No additional proxy infrastructure is required for standard operator access. Standard operators interact with observability data through Portainer; platform engineers and SREs use the OneUptime interface directly for dashboards, incident management, and deep investigation.
Out-of-band alerting is mandatory. Alerts must not rely exclusively on the Portainer management UI. Operators must receive alerts through external channels — OneUptime, PagerDuty, email, Slack — that remain functional when the Portainer interface or the management cluster itself is degraded.
OneUptime back-end, Portainer front-end
Log taxonomy: operational vs. security audit. Operational logs (container stdout/stderr, Kubernetes events, node system logs) and metrics are the subject of this chapter. Security audit logs (Portainer Control Plane events, Kubernetes API server audit log) are covered in Chapter 10 and must be forwarded to the SIEM independently of the operational observability pipeline.
9.2 OneUptime Deployment
OneUptime is an open-source (Apache 2.0), self-hosted observability and incident management platform covering the complete SRE toolchain: log management, metrics, distributed traces, uptime monitoring, incident management, on-call scheduling, and status pages.
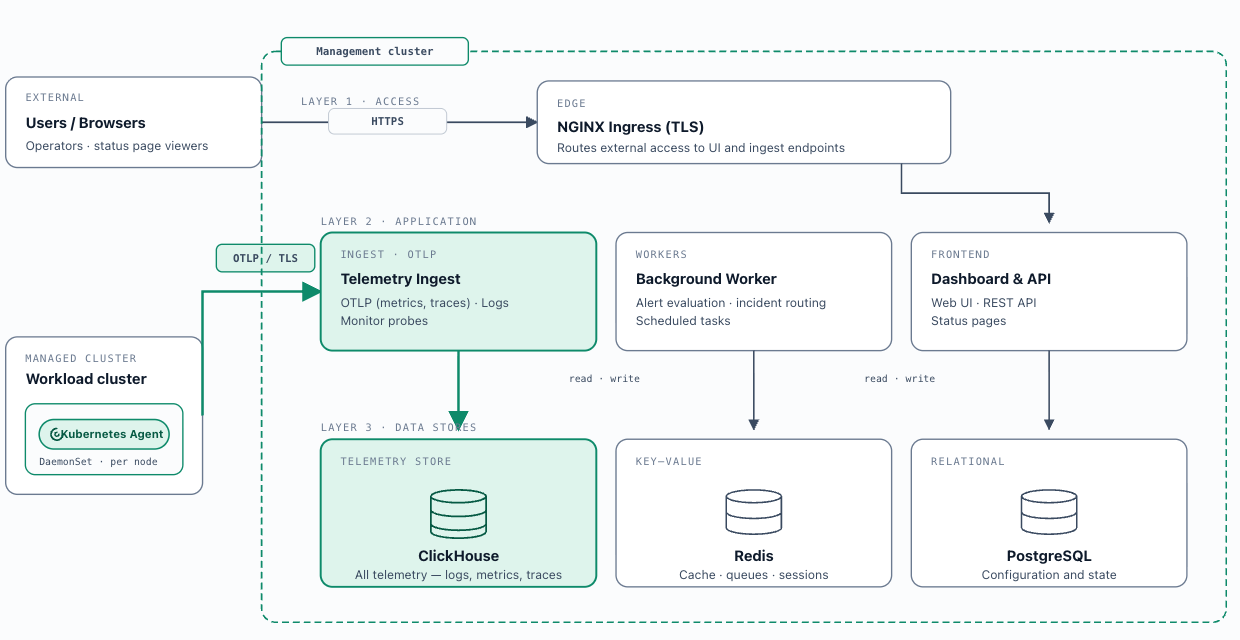
Backend deployment: OneUptime is deployed centrally on the management cluster or on dedicated infrastructure via Portainer's Helm repository integration; the chart is published at helm-chart.oneuptime.com . A single-click backend install from the Portainer UI is on its roadmap. OneUptime's Helm chart deploys all platform components into a dedicated namespace. For production deployments, three data stores are required: PostgreSQL (configuration and state), Redis (caching, queues, and sessions), and ClickHouse (all telemetry — logs, metrics, and traces). Size the management cluster to accommodate both Portainer and OneUptime, accounting for the expected telemetry volume.
OneUptime back-end deployment
Fleet-wide collector deployment — the Observability Policy: Once the central OneUptime instance is running, create an Observability Policy in Portainer, configure the OneUptime connection (URL, API key, Project ID), select an operational mode, and attach it to one or more environment groups. All current and newly added Kubernetes environments in those groups automatically receive the correct collectors and connection configuration. The same policy covers both logs and metrics — no separate policy is needed. These policies applies to Kubernetes environments only; Docker environments are out of scope.
Two operational modes:
Deploy-and-connect: Portainer deploys the OneUptime Kubernetes Agent ( oneuptime/kubernetes-agent from helm-chart.oneuptime.com ) into each attached environment via Helm charts embedded in Portainer. The agent collects cluster metrics, events, and pod logs, forwarding telemetry to the central OneUptime instance via OTLP. Portainer configures itself to query OneUptime for UI enrichment. No separate collector deployment is required.
Connect-only: For environments where OneUptime collectors are already deployed. Portainer validates their presence, configures the connection for UI enrichment, and marks the attachment healthy once prerequisites are confirmed.
Log collection mode: The agent supports two modes. DaemonSet mode (default — self-managed clusters, EKS on EC2, GKE Standard, AKS) runs one collector pod per node reading from node-level log files via a hostPath volume — lowest overhead. API mode (GKE Autopilot, EKS Fargate) reads logs via the Kubernetes API without hostPath volumes — required where pod security standards block host volume access. The agent supports namespace-level filtering ( namespaceFilters.include / namespaceFilters.exclude ), enabling collection scope to align with the namespace-as-tenancy model (Chapter 4).
Portainer UI enrichment: Once the Observability Policy is active, resource views — Helm chart releases, application workloads, and namespaces — gain an Observability tab showing logs and metrics scoped to the current resource. Operators investigate workloads without leaving Portainer. A link-out to the OneUptime interface is provided for deeper investigation, incident workflows, and dashboard access.
Sizing reference
OneUptime stores telemetry across three independent datastores that must be sized separately. ClickHouse absorbs all logs, metrics, and traces and is the dominant cost driver — approximately 95% of storage. PostgreSQL stores configuration, incident records, and platform state; it grows slowly and stays small relative to ClickHouse. Redis handles caches, queues, and sessions; it is memory-bound and modest at any fleet size.
ClickHouse storage formula:
disk ≈ (daily raw telemetry GB ÷ compression ratio) × retention days × replicas × 1.3
Compression ratios per signal type: logs ~5:1 , metrics ~2:1 (high label cardinality reduces compression significantly and inflates RAM disproportionately — enforce low-cardinality label conventions at the collection layer), traces fall between the two.
A reference fleet of 10 clusters, ~10 nodes and ~100 pods per cluster at INFO-level verbosity produces approximately 50–150 GB of raw logs per cluster over 30 days (~1.7–5 GB/day per cluster). Across the full fleet, combining logs, metrics, and traces after compression, budget approximately 5–15 GB/day of compressed ClickHouse data :
| Retention | Single replica | 2 replicas + 30% headroom |
|---|---|---|
| 30 days | ~150–450 GB | ~0.4–1.2 TB |
| 90 days | ~0.45–1.35 TB | ~1.2–3.5 TB |
Storage scales linearly with retention — a 90-day window costs approximately 3× a 30-day window. ClickHouse requires NVMe or fast SSD; it is write-heavy with bursty aggregation reads and will not perform adequately on spinning disk.
Starting tiers (from OneUptime's sizing documentation ):
| Small / PoC | Medium (~10 clusters, ~100 nodes) | Large (50+ clusters, 500+ nodes) | |
|---|---|---|---|
| ClickHouse | 4 vCPU / 16 GB RAM / 200 GB NVMe | 8 vCPU / 32 GB RAM / 1–3 TB NVMe | 16+ vCPU / 64–128 GB RAM / 5–15 TB NVMe (sharded) |
| PostgreSQL | 2 vCPU / 4 GB / 50 GB SSD | 4 vCPU / 8 GB / 100 GB SSD | 8 vCPU / 16–32 GB / 250 GB SSD + PgBouncer |
| Redis | 1 vCPU / 2 GB | 2 vCPU / 4 GB | 4 vCPU / 8–16 GB |
| Raw telemetry | < 5 GB/day | 10–30 GB/day | 100+ GB/day |
| Retention | 30 days | 30–90 days | 90 days |
Two deployment notes before sizing:
- OneUptime's default telemetry retention is 15 days (hardcoded in the default Helm chart). Set retention explicitly per project and per signal type before going to production — unset retention will silently drop data earlier than expected.
- The default Helm chart ships with 25Gi volumes and no resource limits on any component. These are not production values. Override them explicitly using the starting tiers above.
For high availability , enable the bundled CloudNativePG operator (3 PostgreSQL instances with automatic failover) and the Altinity ClickHouse operator (≥2 replicas per shard + 3 Keeper nodes for distributed coordination). The default chart does not include Redis replication — use an external managed Redis for HA deployments.
Actual consumption depends heavily on application log verbosity, number of namespaces, scrape interval, metric cardinality, and whether DEBUG logging is enabled on any workloads. Instrument your environment for at least four weeks before committing to a retention-based storage decision. See OneUptime sizing documentation for the authoritative reference.
9.3 Logs
Portainer Native Log Viewer
Portainer provides built-in container and pod log access directly within its management interface. Platform engineers and developers view real-time and recent container logs from the Portainer UI, for any container running in any managed environment they have access to, without additional logging infrastructure. Log visibility is scoped by Portainer's RBAC model: a user with Namespace Operator access sees logs only for containers in their assigned namespaces; a platform engineer with Environment Administrator access sees all containers in that environment.
💡
These logs are not stored long-term. Only real-time, current logs are shown.
This is appropriate when the team's operational needs are met by per-container log inspection rather than cross-cluster aggregation; compliance requirements do not mandate centralised long-term log retention; and the operational overhead of deploying and maintaining a logging backend is not yet justified. This capability remains available even when an external logging backend is configured.
Log Collection — Observability Policy with OneUptime
For OneUptime deployments, the Portainer Observability Policy in deploy-and-connect mode deploys and manages an OpenTelemetry Collector for log collection on each attached Kubernetes environment. No separate collector deployment is needed. See section 9.2 for Observability Policy configuration.
Log Collection — Loki-based deployments
Teams running an existing logs stack (based on Loki, Alloy and Grafana) can integrate Loki into Portainer’s UI, so that users can query Loki’s logs natively from the Portainer UI — with full support for Portainer’s RBAC.
9.4 Metrics
Portainer Baseline Metrics
Portainer surfaces real-time CPU and memory usage at the cluster, node, and container level, powered by metrics-server . These graphs cover immediate operational awareness — spotting a resource-pressured node, verifying load distribution. They are not retained beyond the current session and are available regardless of whether a metrics backend is deployed.
Metrics Collection — Observability Policy with OneUptime
The Portainer Observability Policy in deploy-and-connect mode deploys an OpenTelemetry collector for metrics on each attached Kubernetes environment alongside the log collector. The collector gathers Kubernetes system component metrics and pod-level telemetry, forwarding to the central OneUptime instance via OTLP. This is the recommended path for new deployments.
Metrics Collection — Prometheus (existing investments)
Teams running an existing metrics stack (based on Prometheus, Alloy/FluentBit and Grafana) can integrate Prometheus into Portainer’s UI, so that users can query metrics natively from the Portainer UI — with full support for Portainer’s RBAC.
Instrumentation
Kubernetes native metrics layer: kube-state-metrics (object-level state: Pod phase, Deployment replica counts, resource limits), cAdvisor embedded in the kubelet (container resource usage per running container), and node-exporter DaemonSet (host-level metrics: CPU, memory, disk I/O, network) are included in kube-prometheus-stack and scraped by Prometheus.
Application metrics: New applications use the OpenTelemetry SDK — a single SDK covers metrics, traces, and logs, is vendor-neutral, and exports to OneUptime or any OTLP-compatible backend without code changes. Existing applications using Prometheus client libraries do not require migration.
9.5 Alerting and Incident Management
Alert Sources
Portainer built-in alerting: Portainer Business Edition includes eight built-in alert rules: environment availability (environment down), resource pressure (high CPU, memory, network usage), authentication anomalies (brute-force attack, high single-user authentication failures), backup failure, and TLS certificate expiry. Notification channels — Slack, Microsoft Teams, email, and webhook — are configurable; alert rules are fixed. Configure Portainer's webhook channel to forward alerts to OneUptime's incoming alert endpoint so Portainer-originated events enter the same incident pipeline as metrics-originated alerts. Alert scoping is per-environment; notifications include direct Portainer links to the affected environment.
OneUptime native monitor rules: Alert rules defined directly in OneUptime against ingested metrics and logs, without a separate Prometheus pipeline. OneUptime evaluates these rules and creates incidents directly — the recommended approach for teams deploying via the Observability Policy.
Prometheus alerting rules: Prometheus evaluates PrometheusRule CRDs on each evaluation interval. When a rule's condition persists beyond the for duration, the alert fires to AlertManager. Rules are version-controlled in Git (Chapter 7). In OneUptime deployments, AlertManager forwards fired alerts to OneUptime via its webhook receiver.
Log-based alerting: OneUptime supports alert rules evaluated against ingested log data — detecting error pattern spikes, specific error messages, or security event patterns that cannot be represented as metric thresholds. A typical example: alert when any container emits more than 20 log lines containing level=error within a 5-minute window, creating an incident before the issue surfaces as a metrics anomaly.
Synthetic monitoring: OneUptime provides built-in uptime monitoring — HTTP, TCP, and ping probes targeting cluster ingress endpoints, the Portainer API, and external DNS. Probes must target endpoints from outside the cluster boundary to provide meaningful availability coverage.
OneUptime as the Alerting and Incident Hub
OneUptime consolidates alert ingestion, incident creation, on-call management, escalation, and status pages in a single platform.
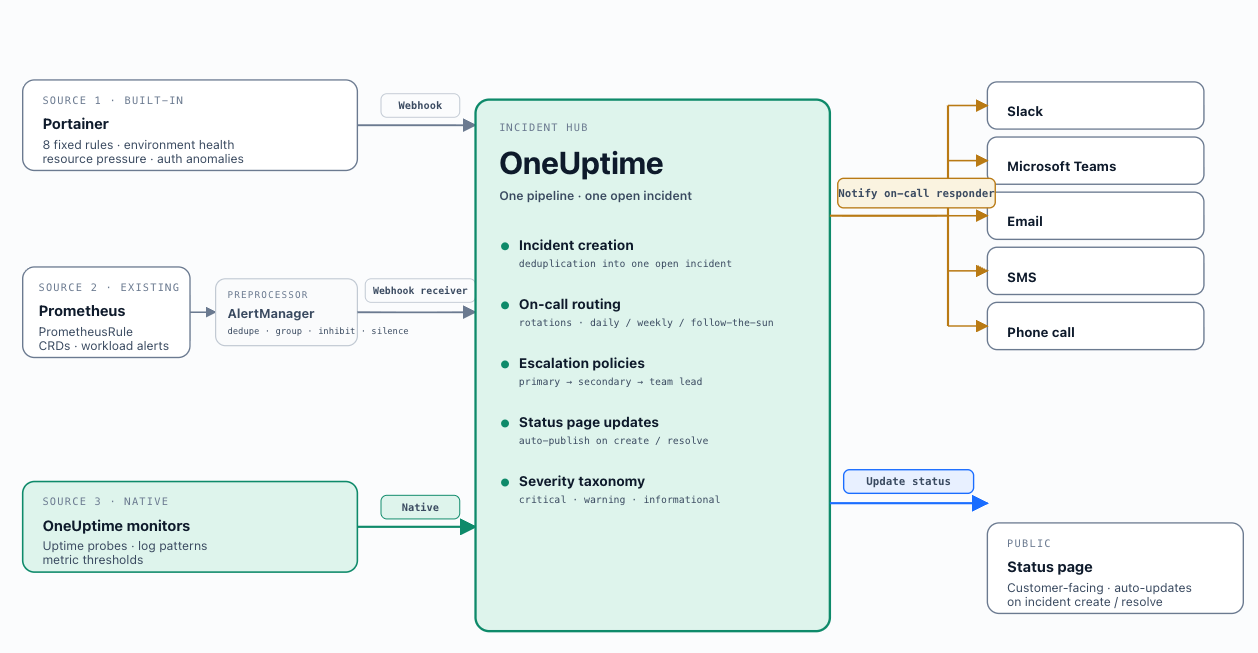
Alert ingestion: OneUptime receives alerts via its incoming webhook endpoint: Portainer's built-in webhook, AlertManager's webhook receiver, and its own native monitor rules. All arrive as structured JSON payloads and are mapped to OneUptime incidents.
Incident management: OneUptime deduplicates repeated firings into a single open incident. Incident metadata includes alert source, severity, affected environment, and a link to the relevant Portainer environment page. Operators access incidents scoped to their project.
On-call scheduling: On-call schedules per project/team with rotation definitions (daily, weekly, follow-the-sun) and escalation layers. When an incident is created, OneUptime notifies the current on-call responder via configured channels (email, Slack, Teams, SMS, or phone). If not acknowledged within the configured window, it escalates to the next layer. Align schedules to Portainer's team structure (Chapter 4).
Escalation policies: A reference policy for critical platform incidents: notify primary on-call immediately → secondary after 5 minutes → team lead after 15 minutes. Map production and staging environments to separate OneUptime projects with independent escalation policies.
Status pages: Status page components reflect Portainer environment groups; pages update automatically when incidents are created or resolved.
OneUptime as the Alerting and Incident hub
AlertManager in OneUptime deployments
In OneUptime deployments, AlertManager narrows its role from full notification routing to forwarding fired Prometheus alerts to OneUptime via webhook receiver. Alert grouping, inhibition rules, and silences remain in AlertManager. Group by cluster and alertname ; define inhibition rules to suppress pod-level alerts when a node-down alert is firing for the same node. Align silences with Portainer's change window model (Chapter 7).
Alert Design
Symptom-based over cause-based: Alert on user-facing or operator-facing impact, not internal state changes. Alert on symptoms; use dashboards to diagnose causes during response.
Severity taxonomy: Three tiers applied uniformly across all alert sources — Prometheus rules, OneUptime monitor rules, and Portainer webhook events. Critical: immediate impact, pages on-call. Warning: potential impact if unaddressed, posts to Slack or Teams. Informational: awareness only, no notification. Encode severity consistently so all downstream routing derives from the same field.
Ownership and runbooks: Every alert must have a defined owner encoded in alert labels ( team=platform-eng ). Every critical and warning alert must carry a runbook_url annotation. Store runbooks in Git alongside the alerting rules that reference them.
SLO-based alerting: For services with defined SLOs, multi-window multi-burn-rate error budget burn rate alerts provide earlier and more accurate signal than threshold-based alerts and are the recommended pattern for production services with formal SLOs.
9.6 Loki, Prometheus, Grafana
Teams with existing investments in Loki, Prometheus and Grafana do not need to migrate to OneUptime. Portainer’s query integration supports Loki and Prometheus in addition to OneUptime. Logs and Metrics from Loki and Prometheus can be surfaced to Portainer’s UI, just like OneUptime, with RBAC enforced natively, with references to Grafana for more advanced dashboards.
For integration guidance of your existing stack into Portainer — architecture Helm values, Alloy collector configuration, namespace setup — contact Portainer’s managed services team.
If your existing on-call workflow runs on PagerDuty or OpsGenie, Portainer's webhook delivers alerts into that pipeline without requiring OneUptime. Per-cluster AlertManager instances route fired alerts to PagerDuty (Events API v2 receiver) or OpsGenie. Portainer's built-in webhook delivers to AlertManager's webhook receiver. Team membership in PagerDuty and OpsGenie must be maintained separately — the shared-OIDC model does not extend to these external SaaS platforms.
9.7 Non-Functional Considerations
Log retention: Operational retention (14–90 days) and compliance retention (1–7 years) require separate configurations. In OneUptime, use project-level settings connected to durable object storage for compliance-grade retention. For Loki, use the compactor's per-tenant retention configuration.
Multi-tenancy via projects: OneUptime’s project model provides the tenant isolation boundary. Each team’s metrics are stored within their designated project. Project membership is governed by the IdP-federated SSO model — users access their scoped project metrics in OneUptime using the same identity as their Portainer session (Chapter 4). The IdP group definition is the single source of truth for access across both systems, allowing users to use the Portainer UI for basic OneUptime usage, but dive into the OneUptime UI for advanced use cases while respecting RBAC.
TLS in transit: All forwarding paths crossing network boundaries must be encrypted. OTel Collector to OneUptime: TLS on the OTLP/HTTP ingest endpoint. Alloy to Loki: TLS on the output plugin. Portainer syslog forwarding: mTLS via --syslog-cert , --syslog-key , --syslog-ca-cert flags.
Alerting pipeline resilience: OneUptime and AlertManager must run on the management cluster independently of the workload clusters they monitor. Configure multiple notification channels in OneUptime so that failure of any single channel does not result in a missed notification.
Cardinality management: Enforce low-cardinality label conventions at the collection layer. Monitor active series counts and alert on unexpected growth before it reaches the backend.
Air-gapped environments: OTel collectors use filesystem buffering; Prometheus uses WAL-based durability — records are retained locally and forwarded when connectivity is restored. For fully air-gapped clusters, deploy a local OneUptime instance; pre-stage OTel collector and OneUptime images in the mirror registry (Chapter 6, Scenario E).
Scenarios and Maturity Levels
The scenarios for each chapter are based on Portainer's maturity levels. See the Appendix for more details about the maturity levels and a link to the assessment. Scenarios build on each other and are relative to each other. Find the scenario closest to your current environment; implement relevant improvements from there.
Teams at early operational maturity use Portainer's built-in log viewer as their sole log access mechanism. Platform engineers and developers access container and pod logs directly within the Portainer UI, scoped to the environments and namespaces their Portainer role permits. No collectors, central backends, or additional infrastructure are required.
This is the entry point. When requirements grow — compliance retention, post-mortem analysis of terminated containers, or cross-cluster correlation — migration to Scenario B and C is non-disruptive. Portainer's built-in log viewer continues to work throughout and after deploying an external backend.
Teams with an existing logging investment retain and extend it. Two common cases:
Cloud-native logging service (CloudWatch Logs, Azure Monitor Logs, GCP Cloud Logging): A lightweight OTel Collector or Alloy DaemonSet on each cluster forwards container logs to the cloud log sink using node-level workload identity. Portainer's built-in log viewer handles real-time access; the cloud service provides retention and search. No migration to OneUptime is required.
Existing Loki deployment: Portainer integrates with the existing Loki instance. Operators query through the Portainer interface with RBAC enforced natively. For implementation guidance — architecture Helm values, Alloy collector configuration, namespace setup — contact Portainer’s managed services team.
Both paths are appropriate for teams where existing tooling is working and the investment in migration is not justified. However, teams can leapfrog this level directly to Level 3 if they’re starting out fresh, without any existing observability tooling.
The recommended path for new deployments without an existing logging backend. OneUptime provides log management, uptime monitoring, and the foundation for incident management in a single platform, deployed and managed through Portainer's Observability Policy.
Deploy a central OneUptime instance on the management cluster or dedicated infrastructure using Portainer's Helm repository integration. Configure an Observability Policy with the OneUptime URL, API key, and Project ID, select deploy-and-connect mode, and attach to the relevant environment groups. Portainer deploys OTel collectors fleet-wide. Once active, logs are accessible through the Portainer Observability tab on workloads, namespaces, and Helm releases, and through the OneUptime interface for deeper investigation and log-based alerting.
This scenario covers the core platform: log ingestion, long-term retention, cross-cluster search, uptime monitoring, and basic alerting. On-call scheduling, full incident management, and status pages are the Scenario D step.
Building on Scenario C, the full OneUptime SRE platform is activated. On-call scheduling and escalation policies route alerts to the right engineer; incident management tracks, documents, and closes incidents with postmortems; customer-facing status pages give external stakeholders real-time health visibility; AI-assisted incident analysis suggests root causes and generates runbooks from historical patterns.
Configure on-call rotations mapping to the platform engineering and SRE teams. Define alert rules against log patterns, uptime checks, and metric thresholds. Connect status pages to relevant monitors. Advanced log-based alerting triggers incidents and on-call notifications directly from log anomalies in the ingested streams, closing the loop from detection to response without manual triage.
Disconnected or sovereign environments where the central OneUptime instance is not always reachable. Two patterns apply depending on connectivity constraints.
Intermittently connected: The OTel collector on each edge cluster uses filesystem buffering — records are retained locally and forwarded to the central OneUptime instance when connectivity is restored. No local OneUptime deployment is required.
Fully air-gapped: A local OneUptime instance is deployed in the disconnected environment as the log storage and incident management backend. OTel collector images must be pre-staged in the mirror registry (Chapter 5, Scenario E). During connected maintenance windows, summarised or sampled telemetry is synchronised to the central instance following the controlled import workflow from Chapter 5. SIEM log data is batched and transferred under the standard change management process (Chapter 10).
Key Decisions Addressed
- Ch9-D-01 — OneUptime Is the Recommended Observability Backend: OneUptime provides a unified platform for logs, metrics, uptime monitoring, alerting, incident management, on-call scheduling, and status pages. For teams already running Loki, Prometheus, or existing alerting tooling, the existing stack is fully supported. — see sections 9.2, 9.3, 9.4, 9.5
- Ch9-D-02 — Observability Is Centralised; Collection Is Distributed: Each managed cluster runs its own collector and forwards to the central backend. Observability data does not transit the Portainer Control Plane. A Control Plane failure does not disrupt collection. — see section 9.1
- Ch9-D-03 — Portainer Is the RBAC Enforcement Layer for Observability Access: Portainer applies its Kubernetes-aligned RBAC model to every log and metrics query. No separate proxy layer is required. Standard operators access observability data through Portainer; platform engineers and SREs use the OneUptime interface directly. — see section 9.1
- Ch9-D-04 — The Observability Policy Manages Fleet Collector Deployment: One policy, attached to environment groups, automatically provisions both log and metrics collectors on all current and future Kubernetes environments in those groups. — see section 9.2
- Ch9-D-05 — OneUptime Backend Deployment via Helm: No single-click backend install exists; deploy via Portainer's Helm repository integration. The Observability Policy manages fleet-wide collector deployment independently of the backend installation. — see section 9.2
- Ch9-D-06 — Out-of-Band Alerting Is Mandatory: Alerts must not be delivered exclusively through the Portainer management UI. Operators must receive alerts through external channels that remain functional when the management cluster is degraded. — see section 9.1
- Ch9-D-07 — Symptom-Based Alerting Over Cause-Based: Alert on user-facing or operator-facing impact. Use metrics and dashboards to diagnose causes during incident response. — see section 9.5
- Ch9-D-08 — Every Alert Must Have a Defined Owner and Runbook Link: Encode ownership in alert labels. Every critical and warning alert must carry a runbook_url annotation stored in Git alongside the alerting rule. — see section 9.5
- Ch9-D-09 — Severity Taxonomy Applied Uniformly Across All Alert Sources: A consistent three-tier taxonomy (critical / warning / informational) across Prometheus rules, OneUptime monitor rules, and Portainer webhook events. All downstream routing derives from this field. — see section 9.5
- Ch9-D-10 — TLS on All Cross-Network Forwarding Paths: OTel Collector to OneUptime: TLS on OTLP/HTTP. Alloy to Loki: TLS on output plugin. Portainer syslog: mTLS via CLI flags. — see section 9.7
- Ch9-D-11 — Dual-Stream Forwarding for SIEM and Operational Backends: Configure the collector to forward records to both the operational backend and the SIEM simultaneously. SIEM delivery must not be blocked by operational backend availability. — see section 9.7
- Ch9-D-12 — Cardinality Discipline Is a Platform-Level Requirement: Enforce low-cardinality label conventions at the collection layer. Monitor active series counts per cluster and alert on unexpected growth. — see section 9.4
- Ch9-D-13 — Prometheus Remote Write for Existing Investments: Teams with existing Prometheus deployments configure remote write to OneUptime's Prometheus-compatible ingest endpoint. This path coexists with the Observability Policy's OTel collection. — see section 9.4